With the market pushing to a new set of highs to begin 2020, and the completion of a Phase One deal between the U.S. and China now in place, a lot of analysts are calling for a continuation of the longest bull market in recorded history. At the same time, I’ve seen a few expressing concern – which I share, by the way – about investor’s apparent eagerness to take on risk, in many individual cases with nothing more to base the latest rally on other than market sentiment. That kind of “unbridled enthusiasm” has consistently been seen at the top of practically every bull market over the last 30 years, and while it isn’t an automatic, leading indication of a near-term bearish turn, it does beg the question of where investors looking for options that can remain useful, and functional in any market can be found. That question has included discussion about two strategies that I like to combine into my own personal investing method: dividend-paying stocks and value analysis.
Neither dividend, nor value investing are automatically defensive in nature as investing strategies; however they do tend to emphasize more conservative measurements and evaluations, including long-term projections than purely growth-driven strategies do. Dividend stocks, for example offer the advantage of a passive income source that can compete reasonably well against the most conservative bond yields, which gives investors a buffer zone to work with in the event that bear market conditions prevail. Value analysis tends to favor stocks that are already trading a deeply discounted levels, which implies that, like dividend stocks, they should generally carry less downside exposure than growth-oriented stocks.
I like to combine both dividends and value analysis in my system whenever I can. The more uncertain the market becomes, it’s also interesting to see how stocks offering the highest dividends start to generate more and more conversation. That’s where today’s stock enters the picture. Royal Dutch Shell plc (RDS.A) is one of the largest integrated oil & gas companies in the entire world – one of the seven oil “supermajors” with operations that span the globe and touch multiple industries within the Energy sector. It’s also a dividend king, with a current dividend yield that is far above that offered by the longest-term Treasury bonds. Even more interesting is the fact that volatility in crude oil prices has has kept the pressure on the stock’s price; it is currently about 10% above its 52-week low, and has more recently dropped dropped about -5% from a near-term peak. That could be an interesting technical set up, or it could signal a reversal of the current upward trend. Does that mean that this could be a good time to make a conservative bet that the stock is also a terrific value? Let’s dig in to find out.
Fundamental and Value Profile
The Royal Dutch Shell plc explores for crude oil and natural gas around the world, both in conventional fields and from sources, such as tight rock, shale and coal formations. Based in the Netherlands, the Company’s segments include Integrated Gas, Upstream, Downstream and Corporate. The Integrated Gas segment is engaged in the liquefaction and transportation of gas and the conversion of natural gas to liquids to provide fuels and other products, as well as projects with an integrated activity, ranging from producing to commercializing gas. The Upstream segment includes the operations of Upstream, which is engaged in the exploration for and extraction of crude oil, natural gas and natural gas liquids, and the marketing and transportation of oil and gas, and Oil Sands, which is engaged in the extraction of bitumen from mined oil sands and conversion into synthetic crude oil. The Downstream segment is engaged in oil products and chemicals manufacturing, and marketing activities. RDS.A’s current market cap is $232.1 billion.
Earnings and Sales Growth: Over the last twelve months, earnings declined a little over -13%, while revenues dropped by -10.5%. In the last quarter, earnings increased a bit over 37% while revenues declined by -2.5%. The company’s margin profile is a bit narrow, but appears to be strengthening; in the last twelve months, Net Income was 5.5% of Revenues, but dropped to 6.56% in the last quarter.
Free Cash Flow: RDS.A’s free cash flow is extremely healthy at $36.2 billion. That translates to a Free Cash Flow Yield of 14.2%. It also marks an increase from the end of the third quarter of the year at $33.6, and more impressively a multi-year surge from -$4.6 billion in September of 2016.
Debt to Equity: RDS.A has a debt/equity ratio of .40. This is a conservative number that reflects a disciplined approach to debt management. RDS.A is an interesting company in the Energy industry, since growth in revenues and earnings can be volatile depending on the direction of crude prices. RDS.A’s conservative approach, however, emphasizes a “lower forever” mindset about capital expenditures and cost management that assumes an average price of around $30 per barrel of Brent crude. That mindset is reflected in the fact that in the last quarter, the company reported around $22.2 billion in cash and liquid assets against about $76.1 billion in long-term debt.
Dividend: RDS.A pays an annual dividend of $3.76 per share, which translates to an annual yield that of about 6.38%. That is one of the highest dividend yields in the entire market, and yet there is no indication the company is likely to need to reduce its payout even if bear market, or even recessionary economic conditions prevail.
Price/Book Ratio: there are a lot of ways to measure how much a stock should be worth; but one of the simplest methods that I like uses the stock’s Book Value, which for RDS.A is $47.68, and which translates to a Price/Book ratio of 1.23 at the stock’s current price. Their historical average Price/Book ratio is 1.2, which means the stock is slightly overvalued by a little more than -3%; however the stock is also trading a little over 22% below its historical Price/Cash Flow ratio, which puts a long-term target price at around $72 per share.
Technical Profile
Here’s a look at the stock’s latest technical chart.
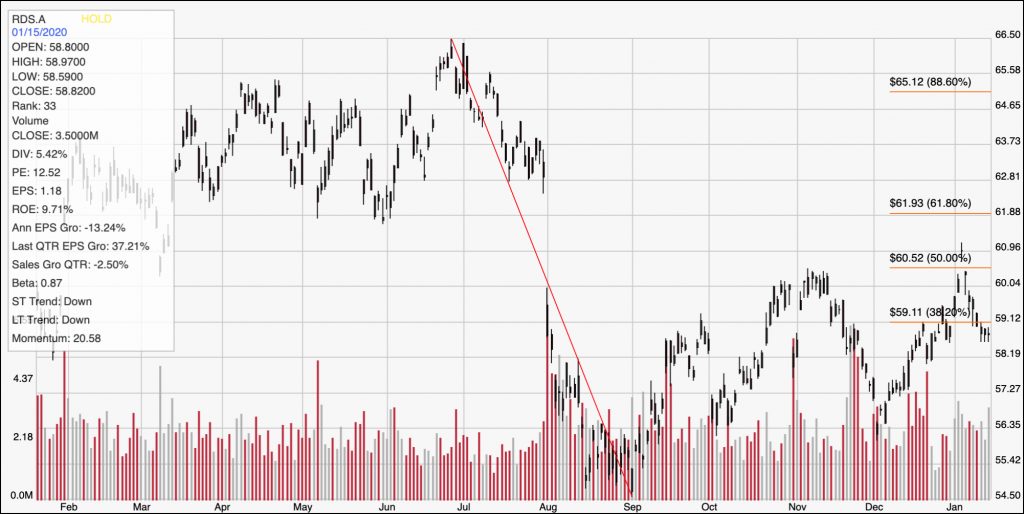
Current Price Action/Trends and Pivots: The diagonal red line on the chart above traces the stock’s decline from late June of this year to its low point at the beginning of September. It also provides the baseline for the Fibonacci retracement lines shown on the right side of the chart. From its low point at around $54.50, the stock has staged an interesting intermediate-term upward trend, reaching a peak at the beginning of January at around $61. It has more recently dropped below the 38.2% retracement line at $59, which marks the stock’s immediate resistance level. Support is around $56 based on pivot lows in early October and December. A break back above $59 should give the stock room to move to about $61 to retest the 50% retracement line, with $62 within reach where the 61.8% retracement line rests.
Near-term Keys: The stock’s current bearish momentum means that the highest probability short-term trade is on the bearish side. The recent drop below support means that it could be a good time to consider shorting the stock or working with put options with an eye on $56 as a profit target point. A pivot and move back above $59 could provide a bullish signal to consider buying the stock or working with call options with a quick exit target around $61. What about the value proposition? The fundamentals are pretty solid; the wide discrepancy between the price targets offered by the stock’s historical Price/Book and Price/Cash Flow ratios leads me to believe that caution is warranted. I believe upside potential could be more limited than the Price/Cash Flow ratio indicates, with the possibility of greater downside risk than the Price/Book ratio signals.