Last week the U.S. and China signed Phase One of most people anticipate will eventually prove to be a long-term trade deal. Investors are now anxiously awaiting Phase Two discussions, and while an actual, next-stage agreement could take some time, you can bet investors are going to be watching with as much interest and uncertainty as they have for the past year and a half. That said, progress is generally likely to be taken as a good thing, as is the likelihood of an expected, peaceful resolution of the U.K.’s exit from the European Union.
Easing tariffs, not only on China, but also on Canada, Mexico, and Europe, with Brexit and a globally accommodative stance from pretty much all of the major central banks should be a positive thing for a lot of industries and sectors. That include companies that operate in the Transportation industry. Triton International Limited (TRTN) is a small-cap stock that may not strike an immediate recognizable chord to the average investor; but their niche, which is leasing shipping containers and chassis equipment, is a business segment that is directly tied and sensitive to global economic conditions. Most market analysts and economists are forecasting growth in the U.S. market, but lower growth on a global scale over the next year. Does that mean that TRTN is a risky stock under current conditions, or a useful opportunity?
The company’s fundamentals are generally solid, with healthy Net Income and Free Cash Flow numbers indicating a highly profitable business. That is counter-balanced, however by very high debt levels. The stock itself has increased in price by about 28% since mid-August. Are the fundamental strong enough to make a case for the stock to keep going higher? Let’s dive into the numbers to find out.
Fundamental and Value Profile
Triton International Limited is a lessor of intermodal containers and chassis. The Company operates through two business segments: Equipment leasing and Equipment trading. The Company’s equipment leasing operations include the acquisition, leasing, re-leasing and ultimate sale of multiple types of intermodal transportation equipment, primarily intermodal containers. The Company purchases containers from shipping line customers and other sellers of containers. The Company resells these containers to container retailers and users of containers for storage and one-way shipments. As of December 31, 2016, the Company leased five types of equipment: dry freight containers, refrigerated containers, special containers, tank containers, and chassis. The Company operated its business through 28 subsidiary offices located in 14 different countries, as of December 31, 2016. TRTN has a current market cap of $2.8 billion.
Earnings and Sales Growth: Over the last twelve months, earnings declined by about -0.85%, while sales dropped almost -4%. In the last quarter, earnings improved by 0.87% while sales declined slightly, by -0.56%. The company’s margin profile is robust, and a clear sign of strength; over the last twelve months Net Income was 23.17% of Revenues, and narrowed somewhat to 24.99% in the last quarter.
Free Cash Flow: TRTN has free cash flow of a little over $777 billion over the last twelve months. This number has increased from June of 2018, when it -$694.79 billion. That translates to a Free Cash Flow Yield of about 28%.
Debt to Equity: the company’s debt to equity ratio is 3.36, a high number that is reflective of the company’s high debt load. Long-term debt is nearly $7 billion as of the last quarter. By comparison, their balance sheet shows $690 million in cash and liquid assets. The company’s margin profile is a strong indication that operating profits are more than adequate to service their debt, however their cash position relative to long-term debt does raise concerns about liquidity.
Dividend: TRTN pays an annual dividend of $2.08 per share, which translates to an annual yield of 5.41% at the stock’s current price.
Price/Book Ratio: there are a lot of ways to measure how much a stock should be worth; but one of the simplest methods that I like uses the stock’s Book Value, which for TRTN is $28.77 per share. At the stock’s current price, that translates to a Price/Book Ratio of 1.33. This is below the stock’s historical average of 1.2. That means the stock overvalued by about -10.11%, putting the stock’s “fair value” price at around $34.50.
Technical Profile
Here’s a look at the stock’s latest technical chart.
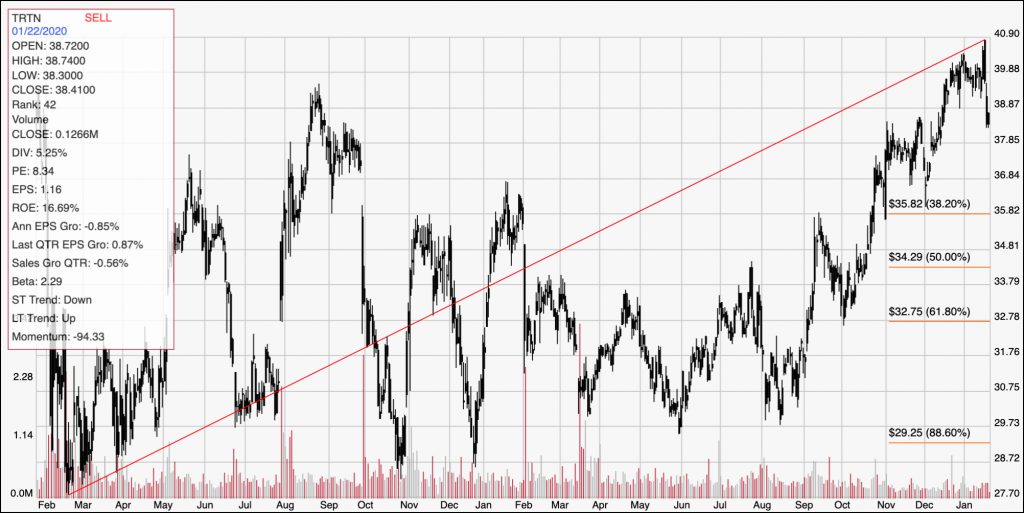
Current Price Action/Trends and Pivots: The chart above shows the last two years of price activity. The diagonal red line traces the stock’s mostly upward trend over that time, and also provides the baseline for the Fibonacci retracement levels shown on the right side of the chart. The greatest portion of the stock’s upward trend came in mid-August, driving the stock from about $30 to its current price a bit above $38 per share. Over the last couple of days, the stock has dropped off of a multi-year high at around $41, and is nearly support at around $38 per share. A drop below that point could see the stock drop to about $36 where the 38.2% retracement sits. Even so, the stock’s upward trend isn’t likely to be reversed unless it drops below $36 per share, with further downside to about $33.
Near-term Keys: TRTN’s valuation metrics aren’t that attractive under current conditions; despite the stock’s healthy profit margins and operating profile, I think their high debt load is a pretty big red flag. That means the best trades in this stock are in short-term trades, with the stock’s current bearish momentum putting the best probabilities on either shorting the stock or working with put options. If the stock drops below $38, consider placing a trade with a quick-exit target at $36, and further downside to $33 if momentum continues to be bearish.