Over the last couple of years, one of the industries that has struggled the most in the stock market has been the Auto industry. That includes stocks in the Auto Components sub-industry. This industry is made up of companies that supply and service automakers. Concern dating back to early 2018 from tariffs and trade tension between the U.S. and its largest trading partners (steel and aluminum tariffs in Europe, for example, and auto duties imposed on Canada and Mexico, to say nothing of the wide-ranging tariffs on China) have pushed practically every auto-related stock in the market into downward trends and near to multi-year lows.
Improving trade relationships between the U.S. and those companies in the latter part of 2019 gave the broad market reason to rally to a new set of all-time highs, and should generally work in the favor of just about every sector and industry, including Autos; but broad, global signs of slowing economic growth have many analysts skeptical about the industry’s growth prospects for the foreseeable future.
A lot of the companies in the Auto Components sub-industry have very interesting fundamental profiles, with value propositions that could make them look very compelling right now. Even if analyst projections about the broad industry prove correct, these are companies that build their business models around their largest customers – Ford, General Motors, Fiat Chrysler, BMW, and Toyota, to name just a few. They also don’t necessarily rely only on new auto sales, but also on aftermarket demand as parts wear out and need to be replaced. Does that mean that stocks like Lear Corporation (LEA) have an attractive opportunity to take advantage of right now? Let’s find out.
Fundamental and Value Profile
Lear Corporation (Lear) is a supplier to the global automotive industry. The Company is engaged in supplying seating, electrical distribution systems and electronic modules, as well as related sub-systems, components and software, to automotive manufacturers. The Company’s segments include Seating and E-Systems. The Company serves the automotive and light truck market. The Seating segment consists of the design, development, engineering, just-in-time assembly and delivery of complete seat systems, as well as the design, development, engineering and manufacture of all seat components, including seat covers and surface materials, such as leather and fabric, seat structures and mechanisms, seat foam and headrests. The E-Systems segment consists of the design, development, engineering, manufacture, assembly and supply of electrical distribution systems, electronic modules and related components and software for light vehicles across the world. LEA’s current market cap is $7.6 billion.
Earnings and Sales Growth: Over the last twelve months, earnings dropped about -13% while revenues declined -1.36%. In the last quarter, earnings dropped by a little more than -5.8%, while sales decreased -3.65%. LEA operates with a narrow margin profile. In the last twelve months, LEA’s Net Income was 3.8%, but narrowed to 2.6% in the last quarter. That narrow margin is a concern, but also not unusual in the Auto Components industry.
Free Cash Flow: LEA’s free cash flow is healthy, at a bit over $963 million. It is a drop from about $1.1 billion in 12/2018, and translates to a Free Cash Flow Yield of 12.2%.
Debt to Equity: LEA has a debt/equity ratio of .53. That is a conservative number that implies a conservative approach to the use of leverage. Their balance sheet shows $1.3 billion in cash and liquid assets against about $2.3 billion in long-term debt.
Dividend: LEA pays an annual dividend of $3.00 per share, which translates to a yield of about 2.38% at the stock’s current price.
Price/Book Ratio: there are a lot of ways to measure how much a stock should be worth; but one of the simplest methods that I like uses the stock’s Book Value, which for LEA is $72.35 and translates to a Price/Book ratio of 1.73 at the stock’s current price. Their historical average Price/Book ratio is 2.6. That suggest the stock is currently about 58% below its “fair value” price; it is also trading about 28.6% below its historical Price/Cash Flow ratio. Together, they provide a long-term target price between $161 and 188 per share.
Technical Profile
Here’s a look at the stock’s latest technical chart.
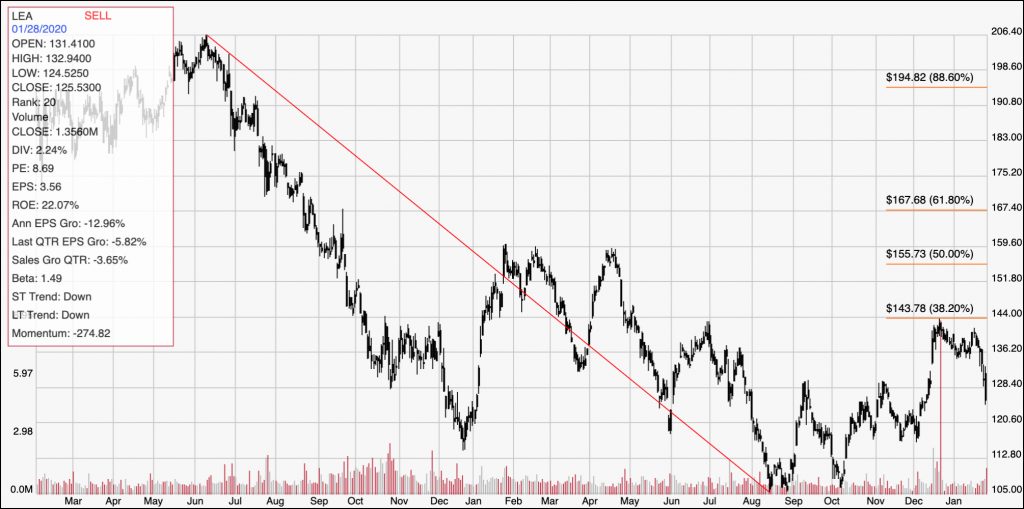
Current Price Action/Trends and Pivots: The red diagonal line measures the length of the stock’s downward trend from June 2018 to its bottom in early August of last year; it also informs the Fibonacci trend retracement lines shown on the right side of the chart. The stock picked up bullish momentum from that low until late December, driving to the 38.2% Fibonacci retracement line; from that point the stock has dropped back, picking up bearish momentum in the last week. It recently dropped below pivot support at around $128.50, with its next support below $120 in the $116 range. If the stock picks up bullish momentum and drives above $128, its next resistance level is between $136 and $144 per share.
Near-term Keys: The stock’s bearish momentum is strong enough that right now the only realistic short-term trade is on the bearish side, either by shorting the stock or working with put options. The stock would need to find support and push above $128 per share before any kind of bullish set up can be considered. If that happens, you could consider buying the stock or working with call options with an eye on $136 as a short-term price target. A bearish trade right now could offer a price target as much as $9 below the stock’s current price. The value proposition for LEA is very attractive; and if you’re willing to be patient and don’t mind the prospect of continued price volatility from the entire industry, could offer an excellent long-term opportunity.