The market has been rebounding strongly this week, with the S&P 500 pushing yesterday near to its all-time high, while the Nasdaq 100 pushed to a new high two days ago. Fears about the long-term impact of coronavirus appear to be fading as the pace of contagion in China drops, with reports of a breakthrough in the fight to contain the outbreak. Add to that the acquittal by the Senate in the Trump impeachment trial, and an earnings season that has generally given investors confidence the U.S. economy continues to be strong; for the time being, a bullish near-term forecast appears to be the smart move right now.
Uncertainty, driven by trade and geopolitics gave investors plenty of reasons to sell off stocks in a number of industries. Financial stocks are among those. Synchrony Financial (SYF) is a company formed in 2014 by the spinoff of GM’s finance arm. Since mid-December, the stock has dropped off of a multi-year high at about $38 per share, with most of that drop coming after the stock’s last earnings announcement in the last week of January. This is a company with a strong fundamental profile, punctuated by strong cash flow, excellent liquidity, and attractive operating margins. Does the stock’s decline, and recent bounce off of support, also mean the stock is a good value? Let’s dive in to find out.
Fundamental and Value Profile
Synchrony Financial is a consumer financial services company. The Company provides a range of credit products through programs it has established with a group of national and regional retailers, local merchants, manufacturers, buying groups, industry associations and healthcare service providers. The Company’s revenue activities are managed through three sales platforms: Retail Card, Payment Solutions and CareCredit. It offers its credit products through its subsidiary, Synchrony Bank (the Bank). Through the Bank, it offers a range of deposit products insured by the Federal Deposit Insurance Corporation (FDIC), including certificates of deposit, individual retirement accounts (IRAs), money market accounts and savings accounts. The Company offers three types of credit products: credit cards, commercial credit products and consumer installment loans. The Company also offers a debt cancellation product. It offers two types of credit cards: private label credit cards and Dual Cards. SYF has a current market cap of $20.6 billion.
Earnings and Sales Growth: Over the past year, earnings were flat, but positive at almost 1%, while sales dropped -7.19%. In the last quarter, earnings dropped by -10%, while sales were down -8%. SYF operates with a healthy margin profile, which isn’t especially unusual for stocks in this industry; over the last twelve months, Net Income was 19.6% of Revenues, and narrowed somewhat to about 15.5% in the last quarter.
Free Cash Flow: SYF’s Free Cash Flow is very healthy, at $9.2 billion, and which translates to an attractive Free Cash Flow Yield of 43.7%.
Debt to Equity: SYF has a debt/equity ratio of 1.38, which is high, but not unusual for stocks in the Financial sector. The company boasts cash and liquid assets of about $11.4 billion in the last quarter versus long-term debt of $19.8 billion. Along with their strong Free Cash Flow and healthy operating profile, there should be no problem servicing their debt.
Dividend: SYF pays an annual dividend of $.88 per share, which at its current price translates to a very attractive dividend yield of about 2.63%.
Price/Book Ratio: there are a lot of ways to measure how much a stock should be worth; but one of the simplest methods that I like uses the stock’s Book Value, which for SYF is $22.21 per share. At the stock’s current price, that translates to a Price/Book Ratio of 1.5. The stock’s historical Price/Book ratio by comparison is 1.79 and puts the top end of the stock’s long-term price target at around $40 per share. That’s just a little under 20%, but still attractive.
Technical Profile
Here’s a look at the stock’s latest technical chart.
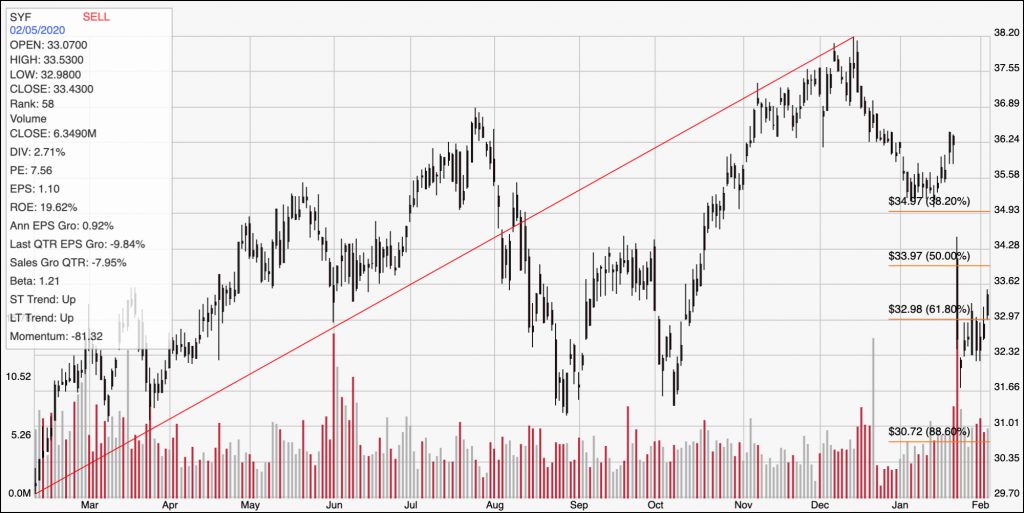
Current Price Action/Trends and Pivots: The diagonal red line marks the stock’s upward trend over the last year. The stock peaked at about $38 in mid-December before beginning a strong downward trend. Following the stock’s last earnings announcement, the stock dropped below the 61.8% Fibonacci retracement line at $32 per share. In the last day, the stock broke above resistance at the 61.8% retracement line, which may be a strong signal the stock is building bullish momentum to about $35 per share. If the stock picks up bearish momentum and drops below $32, the stock’s next support level is a little below $31 per share.
Near-term Keys: The near-term forecast for the stock appears to clearly be on the bullish side, which means that the stock’s recent break above resistance could be used as a useful signal to consider buying the stock outright or working with call options. A drop below $32 could offer an opportunity to consider shorting the stock or working with put options; if bearish momentum picks up, the stock could test its 52-week low below $30 per share. Under the current circumstances, and with most near-term market forecasts clearly on the bullish side, the stock’s value proposition and fundamental strength could offer a compelling reason to think about using the stock as a long-term, value-based opportunity.