The signing of Phase One of a trade deal between the U.S. and China in January gave the market a renewed sense of optimism that long-term trade peace is on the horizon. While this week the market has been rattled by the coronavirus, indications this week suggest that while its impact, particularly in China will definitely be felt on an economic level, it isn’t likely to derail trade progress between the two largest economies in the world. That’s given the market reason to start pushing stocks in the Materials sector higher. In the last week, this sector has increased by a little over 3% as measured by the U.S. Basic Materials iShares ETF (IYM).
Steel Dynamics Inc. (STLD) is an interesting company in the Metals & Mining industry of this sector. Despite a solid fundamental profile, the stock has underperformed the sector; in the last week, it has dropped -3%, and is down almost 20% since early December. Does that also mean the stock is a good value? Maybe. Let’s dive into the numbers.
Fundamental and Value Profile
Steel Dynamics, Inc. is a steel producing and a metal recycling company. The Company is engaged in the manufacture and sale of steel products, processing and sale of recycled ferrous and nonferrous metals, and fabrication and sale of steel joists and deck products. Its segments include steel operations, metals recycling operations, steel fabrication operations and Other Operations. It offers a range of steel products, such as sheet products, long products and steel finishing. The steel operations segment includes Butler Flat Roll Division, Columbus Flat Roll Division, The Techs galvanizing lines, Structural and Rail Division, Engineered Bar Products Division, Roanoke Bar Division, Steel of West Virginia and Iron Dynamics. The metals recycling operations segment consists of OmniSource Corporation. The fabrication operations produce steel building components. The Other Operations segment consists of subsidiary operations and smaller joint ventures. STLD has a current market cap of $6.3 billion.
Earnings and Sales Growth: Over the past year, earnings declined almost -53%, while sales dropped -18.37%. In the last quarter, earnings dropped by -10%, while sales were down -6%. STLD operates with a modest, but adequate margin profile; over the last twelve months, Net Income was 6.4% of Revenues, and narrowed somewhat to about 5.12% in the last quarter.
Free Cash Flow: STLD’s Free Cash Flow is very healthy, at $944.35 million, and which translates to an attractive Free Cash Flow Yield of 14.5%.
Debt to Equity: STLD has a debt/equity ratio of .67, which is reflects a conservative approach to leverage. The company’s balance sheet shows cash and liquid assets of about $1.64 billion in the last quarter versus long-term debt of $2.64 billion. Along with their strong Free Cash Flow and healthy operating profile, there should be no problem servicing their debt.
Dividend: STLD pays an annual dividend of $.96 per share, which at its current price translates to a very attractive dividend yield of about 3.26%.
Price/Book Ratio: there are a lot of ways to measure how much a stock should be worth; but one of the simplest methods that I like uses the stock’s Book Value, which for STLD is $18.20 per share. At the stock’s current price, that translates to a Price/Book Ratio of 1.62. The stock’s historical Price/Book ratio by comparison is 2.23 and puts the top end of the stock’s long-term price target at around $41 per share, which is very attractive.
Technical Profile
Here’s a look at the stock’s latest technical chart.
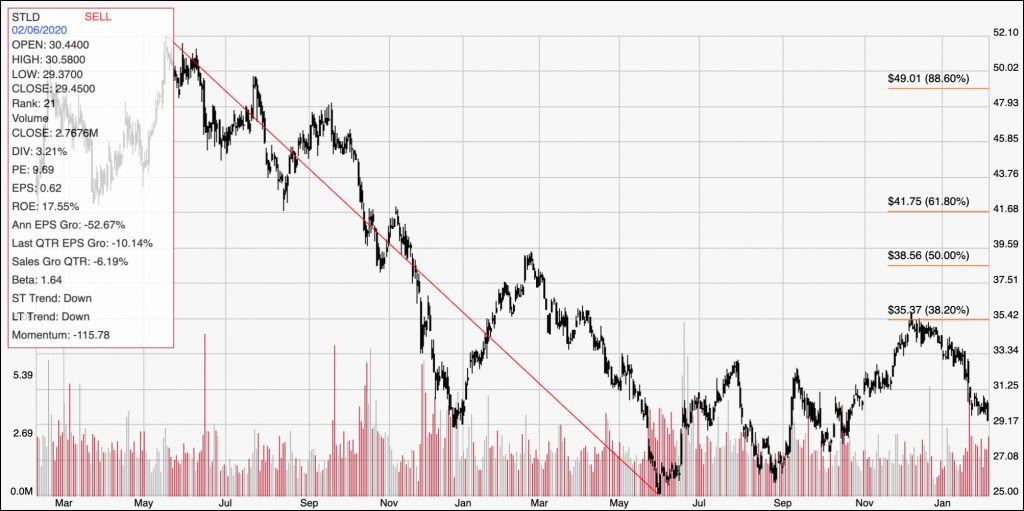
Current Price Action/Trends and Pivots: The diagonal red line marks the stock’s downward trend from May 2018 to May of 2019. It also provides the baseline for the Fibonacci retracement lines on the right side of the chart. The stock rallied from its trend low in September at around $25 to an intermediate trend high in November a little above $35, where the 38.2% Fibonacci retracement line rests. From that point, the stock has dropped back to below $30, but appears to be finding some short-term support in the $29 area. A drop below $29 should see the stock fall to test its trend low around $25. Immediate resistance is around $31; a break above that point could see the stock rally back to the 38.2% retracement line above $35.
Near-term Keys: The near-term forecast for the is clearly bearish, which means that the highest-probability trade right now is with put options or by shorting the stock; use a drop below $29 as a signal to consider a bearish trade. If the stock can break above $31, you could treat it as a strong signal to buy the stock or start working with call options, with a short-term eye on $35 to exit a bullish trade. What about value? The stock’s Price/Book ratio points to big value, and the stock has some very useful fundamental strengths behind it as well. Sentiment about the industry right now is a bit uncertain, but if that settles, this could be an excellent opportunity to buy a good company at a nice price.