Last month, media buzz related to the ongoing, drawn-out grounding of the Boeing 737 Max prompted me to take a serious look at airline carriers to evaluate their exposure to risk resulting from that issue. That’s because continued delays in the 737 Max have forced airline carriers to cancel flights on a widespread basis and to start looking for other options to fill in the massive gaps the grounding has caused. That means that the few carriers who hadn’t previously added the Max to their fleets, or that don’t have pending orders waiting for delivery of a jet that many wonder whether it may not ever be allowed back into service, are likely to be at an advantage in the industry throughout the largest portion of this year.
Delta Air Lines, Inc. (DAL) is a good example of the rare company that isn’t exposed to extended grounding risk related to the Max, simply because it doesn’t have a single Max jet in its fleet. That is probably one of the big reasons that the company’s fundamental profile remained very solid throughout 2019, and is generally expected to stay that way in 2020. The stock’s performance over the last year has also been strong, having increased more than 20% since the beginning of 2019 to the current date. In the last two weeks of January, the stock dropped from a high around $62 to support around $56. It’s a little higher now, and could be setting up for a good short-term rally opportunity. The stock is also coming off of its most recent earnings announcement, with fundamentals that actually make the stock’s value proposition look even better than it did just a month ago.
Fundamental and Value Profile
Delta Air Lines, Inc. provides scheduled air transportation for passengers and cargo throughout the United States and across the world. The Company’s segments include Airline and Refinery. The Company’s route network is centered around a system of hub, international gateway and airports that the Company operates in Amsterdam, Atlanta, Boston, Detroit, London-Heathrow, Los Angeles, Minneapolis-St. Paul, New York-LaGuardia, New York- John F Kennedy International Airport, Paris-Charles de Gaulle, Salt Lake City, Seattle and Tokyo-Narita. Each of these operations includes flights that gather and distribute traffic from markets in the geographic region surrounding the hub or gateway to domestic and international cities and to other hubs or gateways. The Company’s route network includes its international joint ventures, its alliances with other foreign airlines, its membership in SkyTeam and agreements with multiple domestic regional carriers that operate as Delta Connection. DAL’s current market cap is $37.3 billion.
Earnings and Sales Growth: Over the last twelve months, earnings grew by almost 31%, while revenues increased by about 6.5%. In the last quarter, earnings declined about -26%, while sales dropped by almost -9%. The company operates with a healthy margin profile, with Net Income running at 10.14% of Revenues for the last twelve months, narrowing somewhat to 9.64% in the last quarter.
Free Cash Flow: DAL’s free cash flow is healthy, at more than $3.6 billion – an increase from the middle of 2019 of $2.8 billion. That also translates to a Free Cash Flow Yield of 9.64%.
Debt to Equity: DAL has a debt/equity ratio of .92. The company’s balance sheet shows that operating profits are adequate to service their debt. DAL has $1.9 billion in cash and liquid assets as of the most recent quarter against $14.1 billion in debt, which does verify that like most airline stocks, DAL is highly leveraged.
Dividend: DAL pays an annual dividend of $1.61 per share, which translates to a dividend yield of about 2.78% at the stock’s current price.
Price/Book Ratio: there are a lot of ways to measure how much a stock should be worth; but one of the simplest methods that I like uses the stock’s Book Value, which for DAL is $23.87 per share. That number also translates to a Price/Book ratio of 2.41 at the stock’s current price. Their historical average Price/Book ratio is 2.9. That suggests the stock is trading right now at a discount of almost 20%, which is pretty attractive.
Technical Profile
Here’s a look at the stock’s latest technical chart.
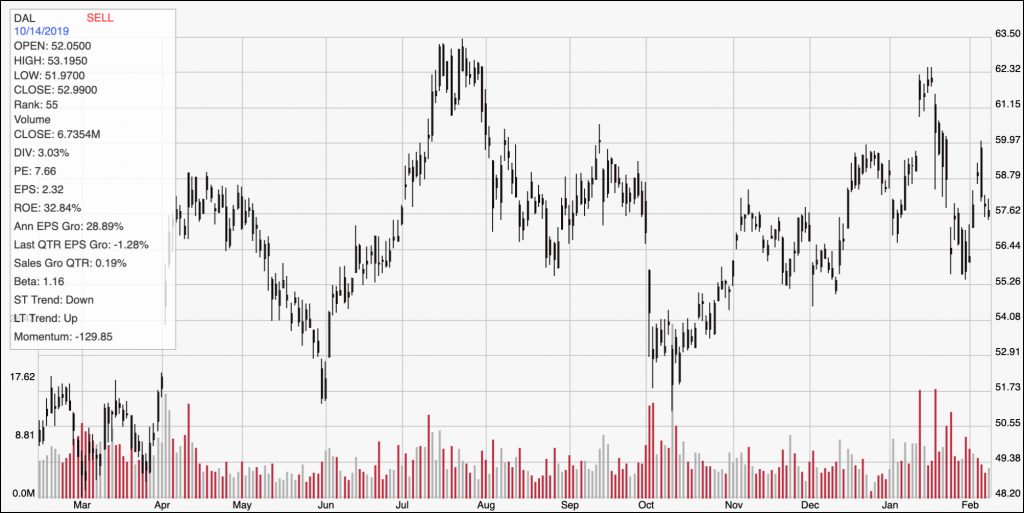
Current Price Action/Trends and Pivots: The chart above traces DAL’s price action over the last year. The stock dropped from its 52-week high around $63.50 in July to a low in October at around $53 per share, and then staged a new upward trend from that point to a peak at around $62 in mid-January. From that point, the stock dropped back to find support at around $56 at the end of the month, then pushed to another high last week at nearly $60 before slipping back again to its current price. If the stock can break above $60, it should be able to test its January high at $62, or possibly its 52-week high at $63.50 if that momentum can continue. If the stock drops below support at $56, it could slide all the way to lows around $52 seen in October and June.
Near-term Keys: The fundamentals for DAL are solid, and the value proposition is much better than it was just a few weeks ago. If the stock can pick up bullish momentum and push above $60, you could use the move as a signal to buy the stock or start working with call options, with an eye on $62 as a quick-hit profit target. A drop below $56, on the other hand, would be a good signal to consider shorting the stock or working with put options, with $52 acting as a very nice bearish trade target. From value-based standpoint, the stock is looking even better than it was a month ago. If the idea of some near-term, industry-driven price volatility doesn’t frighten you, DAL could offer a very interesting long-term opportunity.