It’s interesting to see how market dynamics affect different industries and sectors of the economy at different points in time. Historical trends and norms prompt us to categorize certain areas of the market as “defensive” or “cyclical,” “aggressive” or “conservative” simply because of the way the price activity those areas, or even individual stocks have previously correlated or diverged from the broad market. The problem with getting too locked in to those norms is that sometimes, they just don’t apply.
The Consumer Staples sector is an interesting example of what I mean. When the market moved into the first stages of correction at the end of September 2018, this was one of the only sectors that initially managed to hold its ground; in fact, from mid-October to the first week of November, the sector managed to rally more than 10% as measured by the S&P 500 Consumer Staples Sector SPDR ETF (XLP). From that point, however, the sector finally capitulated to the overwhelmingly bearish tone the broader market had taken by that time; from that high point to the last week of December, the sector dropped back more than 15%.
Following that end-of-the-year capitulation, investors started gravitating back towards the sector in 2019, pushing a number of stocks in the sector into some impressive upward trends through most of the year. Over the last couple of months, that momentum has tapered off a bit, with some of those stocks coming off of those trend high points to form interesting shorter-term pullback patterns.
Conagra Brands, Inc. (CAG) is an interesting case in point. The stock dropped from around $40 in late 2018 to a low point before the beginning of 2019 at around $20 before buying activity picked up and drove the stock into an upward trend that peaked in December 2019 at around $35.50 per share. Market uncertainty from that point has pushed the stock about -10% lower, to start consolidating in a pretty narrow range over the last month. Easing trade tensions and generally solid economic data suggest that the market’s long, bullish trend has a good basis for extending throughout 2020, but in the last few weeks fears about coronavirus and its long-term impact, primarily in China have put a lot of investors on edge. That could mean that defensive stocks like CAG is in a nice position.
Fundamental and Value Profile
Conagra Brands, Inc., formerly ConAgra Foods, Inc., operates as a packaged food company. The Company operates through two segments: Consumer Foods and Commercial Foods. The Company sells branded and customized food products, as well as commercially branded foods. It also supplies vegetable, spice and grain products to a range of restaurants, foodservice operators and commercial customers. Conagra Foodservice offers products to restaurants, retailers, commercial customers and other foodservice suppliers. The Company also operates in the countries outside the United States, such as Canada and Mexico. The Company’s brands include Marie Callender’s, Healthy Choice, Slim Jim, Hebrew National, Orville Redenbacher’s, Peter Pan, Reddi-wip, PAM, Snack Pack, Banquet, Chef Boyardee, Egg Beaters, Rosarita, Fleischmann’s and Hunt’s. The Company sells its products in grocery, convenience, mass merchandise and club stores. CAG’s current market cap is $15.9 billion.
Earnings and Sales Growth: Over the last twelve months, earnings decreased about -6%, while Revenues grew 18.3%. In the last quarter, earnings increased to 46.51%, while Revenues improved by nearly 18%. The company’s margin profile over the last twelve months is improving, with Net Income at 7.62% of Revenues over the past twelve months, and increasing in the last quarter to 9.23%.
Free Cash Flow: CAG’s free cash flow is modest, but strengthening at $898.2 million. That marked an increase from $575.6 million at the beginning of 2019, and translates to a Free Cash Flow Yield of about 5.65%.
Debt to Equity: CAG has a debt/equity ratio of 1.21. That number declined from 1.58 at the beginning of 2019, but the number remains high, a reflection of the reality that the company’s liquidity could be a problem. In the last quarter Cash and liquid assets were $142 million versus $9.25 billion in long-term debt. Most of that debt is attributable to CAG’s acquisition of Pinnacle Foods in the last quarter of 2018. The complexities associated with the transition of the two companies into one is part of the reason the stock struggled into the early part of 2019, but reports in the last two quarters indicate that the synergies the company has worked to achieve have been working. In the last year, long-term debt declined by about $2 billion, which is a positive.
Dividend: CAG pays an annual dividend of $.85 per share, which translates to an annual yield that of about 2.61% at the stock’s current price.
Price/Book Ratio: there are a lot of ways to measure how much a stock should be worth; but one of the simplest methods that I like uses the stock’s Book Value, which for CAG is $15.80. This marks a remarkable increase from just $9.74 in the third quarter of 2018. At the stock’s current price, their Book Value translates to Price/Book ratio of 2.06 versus an average historical Price/Book ratio of 3.31, which means that even with the stock’s recent rally, it remains more than 60% below a long-term target price at around $52 per share.
Technical Profile
Here’s a look at the stock’s latest technical chart.
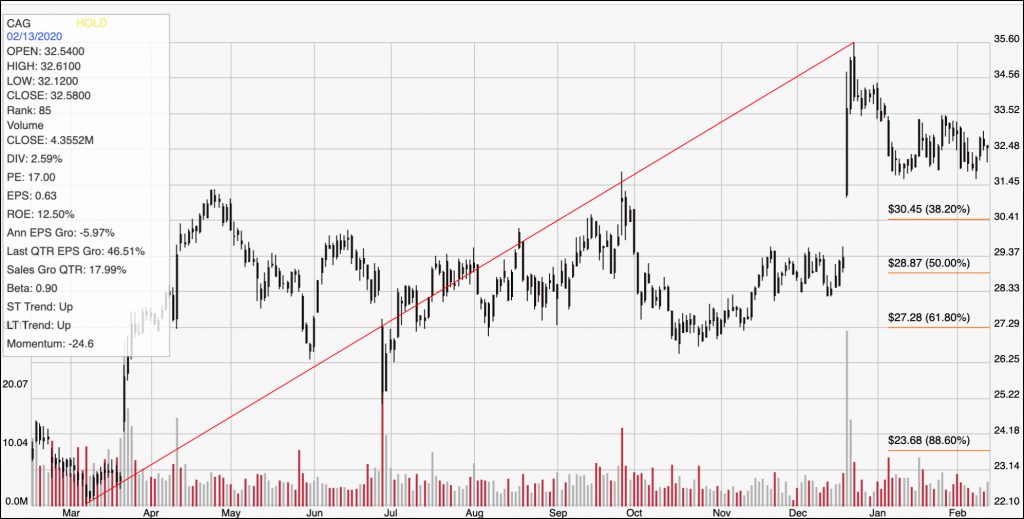
Current Price Action/Trends and Pivots: The chart above marks the stock’s upward trend beginning in March of last year to its December peak at around $35.50. It also provides the baseline for the Fibonacci retracement lines shown on the right side of the chart. From the peak, the stock dropped back to support at about $32 per share. That level has held since early January, with resistance at about $33.50. A break above $33.50 should see the stock test $35.50 in short order, with its 2018 peak at around $39 in range from that point. A drop below $32 should see the stock stabilize around the 38.2% Fibonacci line between $29 and $30.
Near-term Keys: From a fundamental standpoint, CAG’s profile is very attractive, and its value proposition remains very interesting. If you prefer to work with short-term strategies, a break above resistance at $33.50 would be an interesting signal to consider buying the stock or buying a call option with an eye on $35.50 to $38 as an exit target. A drop below $32 could act as a signal to consider shorting the stock or working with put options, using $30 as a quick exit target level on a bearish trade.