I’ve started this week by diving into stocks in the Materials sector. The market’s rally over the last week or so has been good for a number of sectors, including Materials, as economic indicators show that the U.S. remains healthy. Volatility in the oil market can wreak havoc at times with some of the stocks in this sector – especially in the Chemicals industry, which tend to see the prices of the commodities and raw materials they rely on for their finished goods rise and fall to some extent, relative to energy prices. Coronavirus is just the latest element that has added to pressure on crude prices, and that has contributed to some of the sector’s volatility in the last month.
In the long run, I think that volatility is going to translate to useful opportunities to work with some of the most effectively managed companies in the sector at better prices than ever. That doesn’t mean they’re all at that price yet – but it does make the sector one that is worth watching in the weeks and months ahead. On a selective basis, you may even find stocks that are at good bargain prices now – and that could be a very good thing to take advantage of right now.
One of the stocks I came upon over the weekend that I think fits that description is CF Industries Holdings Inc (CF). This is a mid-cap producer of nitrogen and phosphate fertilizer. That makes them highly dependent on natural gas, and subject to the variances in prices of that energy commodity. Even so, CF boasts a solid fundamental profile and an excellent value proposition that just might be too good to pass up right now.
Fundamental and Value Profile
CF Industries Holdings, Inc. manufactures and distributes nitrogen fertilizer, and other nitrogen products. The Company’s nitrogen fertilizer products are ammonia, granular urea, urea ammonium nitrate solution (UAN) and ammonium nitrate (AN). Its other nitrogen products include diesel exhaust fluid (DEF), urea liquor, nitric acid and aqua ammonia, which are sold primarily to the Company’s industrial customers, and compound fertilizer products (nitrogen, phosphorus and potassium or NPKs). The Company’s segments include ammonia, granular urea, UAN, AN and other. The Company’s ammonia segment produces anhydrous ammonia (ammonia), which is concentrated nitrogen fertilizer as it contains 82% nitrogen. The granular urea segment produces granular urea, which contains 46% nitrogen. The UAN segment produces urea ammonium nitrate solution. The Other segment includes DEF, urea liquor, nitric acid and NPKs. The Company’s primary nitrogen fertilizer products are ammonia, granular urea, UAN and AN.CF has a current market cap of about $8.3 billion.
Earnings and Sales Growth: Over the last twelve months, earnings increased by 19%, while revenues slipped by -7.33%. In the last quarter, earnings dropped by -13.8% while sales were flat, but positive by a little more than 1%. The company’s margin profile is healthy, but shows signs of narrowing, which is a concern; Net Income as a percentage of Revenues in the last quarter is 5.24% versus 10.7% over the last twelve months.
Free Cash Flow: CF’s free cash flow is $1.17 billion. That translates to a very attractive Free Cash Flow of a little more than 14%.
Debt to Equity: CF’s debt to equity is .74, a conservative number that signals the company’s conservative approach to leverage. Their balance sheet shows cash and liquid assets were $1 billion in the last quarter versus $3.95 billion in long-term debt. Their operating profile indicates that they have sufficient operating income to service their debt, with good liquidity to add to the mix.
Dividend: CF’s annual divided is $1.20 per share, which translates to a yield of about 3.13% at the stock’s current price.
Price/Book Ratio: CF’s Book Value is $25.93, which translations to a Price/Book ratio is 1.48 versus their historical Price/Book ratio of 2.72, which suggests that the stock is significantly undervalued by more than 84% right now. That puts the stock’s long-term target price above $70 per share.
Technical Profile
Here’s a look at the stock’s latest technical chart.
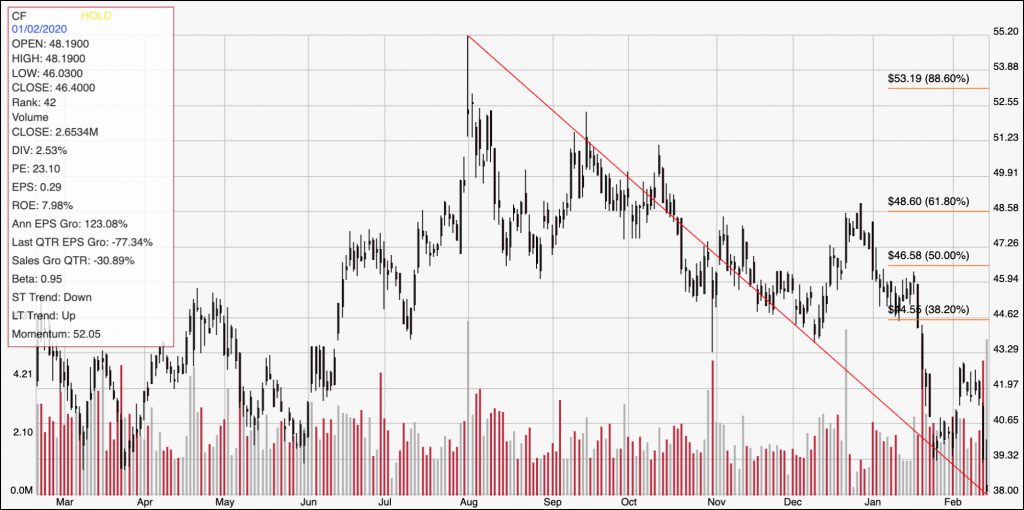
Current Price Action/Trends and Pivots: The diagonal red line traces the stock’s downward trend from July of last year to to its current price, and provides the reference for calculating the Fibonacci retracement levels shown by the horizontal red lines on the right side of the chart. The stock has seen a sharp decline in price since late December, dropping from the 61.8% retracement line around $48.50 to its current price just a little above $38 per share. The last couple of days added to that bearish momentum following the latest earnings report, which generally lagged market expectations. Immediate resistance is at around $42, from the stock’s latest pivot high, while closest support is likely to be around $36 based on pivots last seen in April of 2018 (not visible on this chart). If the stock can find a level of support between its current price and $36, it could see bullish momentum push the stock back to $42, with the next resistance at the 38.2% Fibonacci retracement line around $44.50 per share. If $36 doesn’t hold valid support, the stock could drop to between $32.50 and $34.
Near-term Keys: CF’s fundamentals are strong, with a value proposition that has been getting better and better while the stock has dropped. Its current bearish momentum is very strong, however, so even a value-oriented investor might want to wait to see the stock start to stabilize before taking a long-term position seriously. If the stock drops below $36, there could be an interesting opportunity to short the stock or work with put options, with an eye on a profit target at around $33, or possibly $32.50. On the other hand, if the stock starts to stabilize above $36, you could think about buying the stock or working with call options, with a quick-hit profit target at around $42 for a bullish trade.