After the U.S. and China finally agreed to the first phase of what most people hope becomes a long-term trade deal between the world’s two largest economies, most analysts began predicting a bullish future for the global markets through the rest of the year. Even initial reports about the outbreak and rapid spread of coronavirus in China didn’t really phase investors from pushing the markets to fresh, new all-time highs by the end of last week. More recent reports, however not only showing an increase in the spread of the virus as well as in in the death toll seem to have finally forced companies to start factoring its effects into their forecasts.
Most recently, Apple Computer (AAPL) made its latest quarterly earnings report, and included pretty straight talk about its expectations for lower revenues, due primarily to what it believes will be lower demand attributable directly to coronavirus. Goodyear Tire & Rubber Co. (GT) is another example of a company in an industry that most analysts would have expected to benefit from trade peace; but the expanding, and increasingly worrisome near-term effects of coronavirus is something that stands to effect GT even more directly than other companies.
GT has a plant in China that was among the many Chinese business operations idled because of the virus; exactly what the impact of that interruption will be, as with most businesses, remains to be seen, but it does reflect some of the increasing risks that some investors appear to perceive in the current market. That has pushed the stock near to multiyear lows last seen prior to the fourth quarter of 2019 at around $10 per share, extending the stock’s long-term downward trend and putting the prospects of even lower prices in clear view. Are the stock’s fundamentals strong enough to make the stock a big value, or is it simply a cheap stock that a smart investor should stay away from?
Fundamental and Value Profile
The Goodyear Tire & Rubber Company is a manufacturer of tires. The Company operates through three segments. The Americas segment develops, manufactures, distributes and sells tires and related products and services in North, Central and South America, and sells tires to various export markets. The Americas segment manufactures and sells tires for automobiles, trucks, buses, earthmoving, mining and industrial equipment, aircraft and for various other applications. The Europe, the Middle East and Africa (EMEA) segment develops, manufactures, distributes and sells tires for automobiles, trucks, buses, aircraft, motorcycles, and earthmoving, mining and industrial equipment throughout EMEA under the Goodyear, Dunlop, Debica, Sava and Fulda brands. The Asia Pacific segment develops, manufactures, distributes and sells tires for automobiles, trucks, aircraft, farm, and earthmoving, mining and industrial equipment throughout the Asia Pacific region, and sells tires to various export markets. GT’s current market cap is $2.6 billion.
Earnings and Sales Growth: Over the last twelve months, earnings declined almost -63%, while sales dropped about -4.2%. The picture isn’t better in the last quarter, with earnings dropping -58% and sales declining by -2.34%. GT is a company that historically operates with a narrow margin profile, but that in recent quarters has deteriorated significantly. In the last quarter, Net Income as a percentage of Revenues was -10.55% versus -2.1% in the last twelve months.
Free Cash Flow: GT’s free cash flow measurement is a significant, and perhaps the only mark of positive news in the company’s fundamental profile. Over the last twelve months, Free Cash Flow was $449 million – an increase from -$59 million at the beginning of 2019. That’s a positive improvement in the last year of more than $500 million and is perhaps the best indication that GT’s fundamentals may not be as bad as most perceive.
Debt to Equity: GT has a debt/equity ratio of 1.19. That is a bit high, but this is actually a pretty typical pattern for most companies in the Auto Components industry, and isn’t alarming by itself. That said, GT’s liquidity, which was very healthy just a few years ago (more than $2 billion at the beginning of 2015) has been consistently declining since that point. As of the last quarter, the company had $908 million in cash and liquid assets against about $5.4 billion in long-term debt; this is also a number that has declined by about $1 billion since June of last year. Their balance sheet indicates that they should be able to maintain their debt service without too much difficulty, with cash reserves that remain generally healthy, but are admittedly under pressure from the company’s poor operating margins. If that pattern continues, liquidity will become a major concern.
Dividend: GT pays an annual dividend of $.64 per share, which translates to a yield of just a little over 5.77% at the stock’s current price.
Price/Book Ratio: there are a lot of ways to measure how much a stock should be worth; but one of the simplest methods that I like uses the stock’s Book Value, which for GT is $19.53 and translates to a Price/Book ratio of .58 at the stock’s current price. Their historical average Price/Book ratio is 1.44, which puts a long-term target around $28 for the stock. GT is also trading almost 124% below its historical Price/Cash Flow ratio, which puts the stock’s long-term target at a somewhat lower, but still interesting $25 per share.
Technical Profile
Here’s a look at the stock’s latest technical chart.
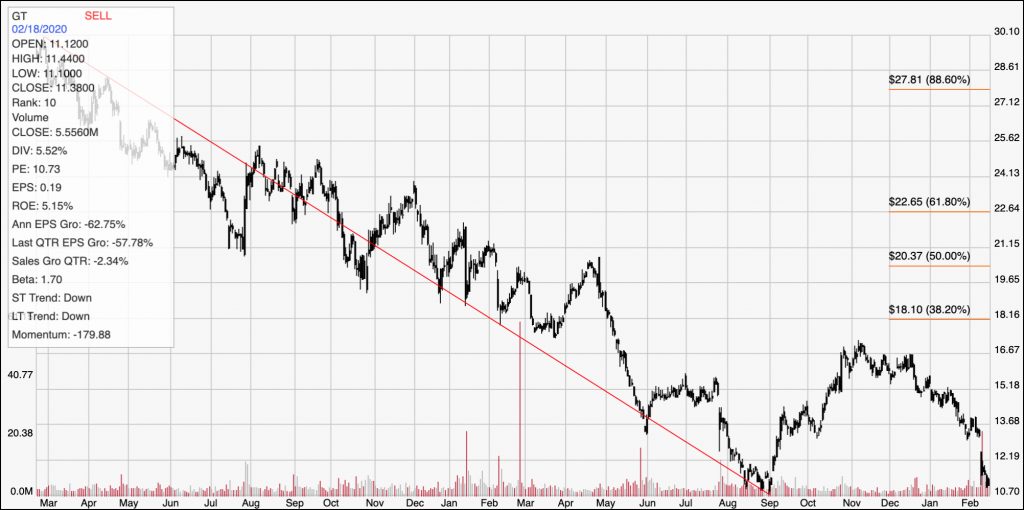
Current Price Action/Trends and Pivots: The diagonal red line traces the stock’s downward trend over the last two years. It also provides the baseline for the Fibonacci retracement lines on the right side of the chart. After bottoming a little below $11 in September 2019, the stock rallied strongly into November to a peak at around $17 per share. The downward trend reasserted itself from that point, however, with bearish momentum pushing the stock back near to those September lows. Support is around $10.70, with immediate resistance around $14 per share. An actual reversal of the downward trend will not be seen unless the stock can drive above its November peak at $17 per share.
Near-term Keys: GT’s value proposition certainly is very tempting, but I think that the holes int he company’s fundamental profile are most punctuated by the accelerating pattern of negative Net Income right now. If near-term pressure from factors like coronavirus remains heavy on the downside, this is a stock that could drop even below its lows around $10.70 and to levels not seen since 2012 around $9 or even down to levels last seen a decade ago below $5. It’s hard to provide any kind of bullish forecast under these kinds of circumstances – even for a short-term bullish trade. The exception to that rule could come if the stock can find support and drive back above the $14 level; in that case, the stock should rally back to the November peak around $17. A very aggressive investor who doesn’t mind speculating might consider that an opportunity to buy the stock or even to work with call options; but I would be skeptical of looking for much upside past $17, unless the company can begin to show more significant signs of fundamental improvement – starting first with a sustained improvement in Net Income.