The Consumer Discretionary sector includes stocks that cover a wide variety of the Retail industry. Because there are so many retail companies that offer different products to consumers, it’s hard to pinpoint any kind of specific niche. This is a sector that has performed strongly in 2020, and is off to a pretty good start this year; as measured by the S&P 500 Consumer Discretionary sector (XLY) is up almost 2.3% since January.
Because of the wide disparity of retail business types, the sector includes an industry category called Specialty Retail. Stocks in this industry include department stores like Kohl’s (KSS) and electronic and gadget stores like Best Buy (BBY), to name just a couple for illustration purposes. Another stock in this industry that is interesting, in part because of the way it hasn’t followed the sector’s trend is Dick’s Sporting Goods Inc. (DKS). While the sector has moved strongly since the beginning of the year, DKS has struggled, dropping about -13.3% off of its multiyear high at almost $50.
Another reason DKS is interesting is in the way it has responded to industrywide pressures to adapt to changing consumer preferences and intensifying competition. Like a lot of retail companies, DKS has been forced to contend with the fact that consumers increasingly prefer to buy online versus traditional, in-store shopping; another area that has seen the type of competition change comes from big-name suppliers like Nike, Under Armour, and more that have themselves made moves to decrease their reliance on traditional retailer in favor of their own e-commerce delivery systems. DKS is pushing their own online commerce business forward, bringing their online presence in-house versus using a third-party provider, and expanding the scope of private label brands to counter supplier pressure. They have also bucked the industrywide trend, which has decreased the presence of traditional, big-box stores by expanding their national footprint via acquisition of properties, largely from now-defunct competitors. Together, does it all translate to a useful value in a sector that looks poised to keep performing well? Let’s find out.
Fundamental and Value Profile
Dick’s Sporting Goods, Inc. is an omni-channel sporting goods retailer offering an assortment of sports equipment, apparel, footwear and accessories in its specialty retail stores primarily in the eastern United States. The Company also owns and operates Golf Galaxy, Field & Stream and other specialty concept stores, and Dick’s Team Sports HQ, an all-in-one youth sports digital platform offering free league management services, mobile applications for scheduling, communications and live scorekeeping, custom uniforms and FanWear and access to donations and sponsorships. The Company offers its products through a content-rich e-commerce platform that is integrated with its store network and provides customers with the convenience and expertise of a 24-hour storefront. It offers products to its customers through its retail stores and online. The Company offers hardlines, which include items, such as sporting goods equipment, fitness equipment, golf equipment, and hunting and fishing gear. DKS’s current market cap is $3.8 billion.
Earnings and Sales Growth: Over the last twelve months, earnings increased 33.33%, while were also up 5.65%. In the last quarter, earnings declined -58.75%, while sales dropped by a little over -13%. Like most retailers, DKS’s margin profile is pretty narrow; over the last twelve months Net Income was about 3.82% of Revenues, but decreased somewhat to 2.93% in the last quarter – a confirmation of the struggle the entire industry has faced over the last year.
Free Cash Flow: DKS’ free cash flow is modest, at about $111 million over the last twelve months. That translates to a Free Cash Flow yield of 2.9%. It should be noted that Free Cash Flow dropped from more than $500 million at the beginning of 2019.
Debt to Equity: DKS has a debt/equity ratio of 1.89. This is a high number that also represents a massive jump in the last quarter, when it was just .03. Their balance sheet also reflects their very high degree of leverage, with $3.22 billion in long-term debt versus just $89 million in cash and liquid assets. While servicing their debt doesn’t appear to be a concern for now, these numbers, along with their narrow margin profile and weakening free cash flow, do raise the question of the company’s liquidity moving forward. The lion’s share of the increase in debt is also attributable to DKS’ aggressive push to expand and open more stores nationwide via acquisition.
Dividend: DKS pays an annual dividend of $1.10 per share, which translates to a yield of 2.53% at the stock’s current price.
Price/Book Ratio: there are a lot of ways to measure how much a stock should be worth; but one of the simplest methods that I like uses the stock’s Book Value, which for DKS is $20.35 per share and translates to a Price/Book ratio of 2.13 at the stock’s current price. Their historical Price/Book average is 2.4, which suggests that the stock is undervalued by about 13% and puts the stock’s long-term target price near its recent high a little below $49 per share. Their Price/Cash Flow ratio is only about 2.5% below its historical averages.
Technical Profile
Here’s a look at the stock’s latest technical chart.
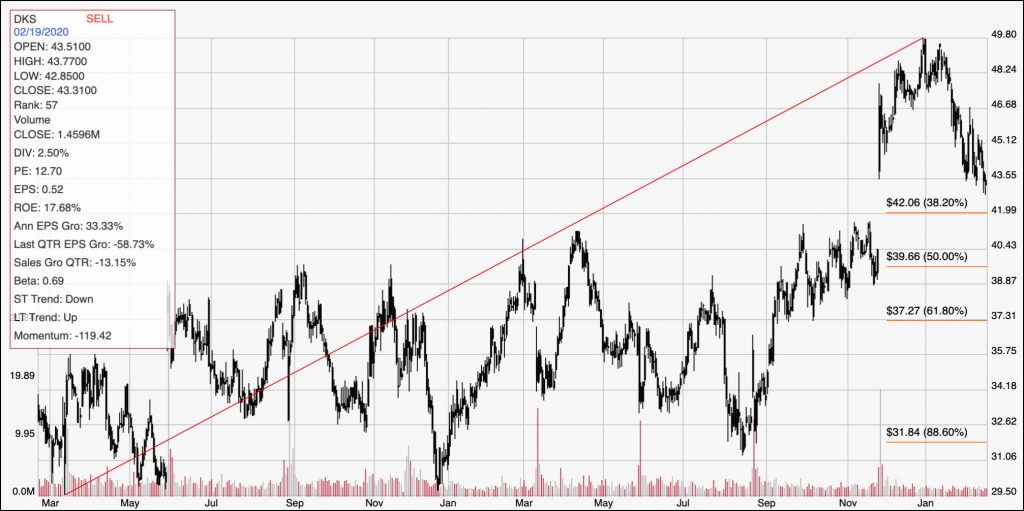
Current Price Action/Trends and Pivots: The chart above displays the last two years of market activity for DKS. It also traces the stock’s generally upward trending movement from March 2018 around $29.50 to almost $49 per share. From that point, the stock has started to drop near to the 38.2% Fibonacci retracement line at around $42 per share. Resistance is around a recent pivot high at about $46.50 per share. A drop below $42 could see the stock drop to about $39 below the 50% retracement line, with further downside to the 61.8% retracement line around $37 if bearish momentum picks up. If the stocks can find support between its current price and $42, it should have good bullish momentum to push to about $46.50, with the high around $49 within sight if the upward trend finds new strength.
Near-term Keys: Given the stock’s narrowing fundamentals, I think its upward trend is in danger of reversing into a intermediate downward trend. That means that the highest-probability trade is following the stock’s short-term, bearish momentum. A break below $42 would be a strong signal to consider shorting the stock or working with put options. If the stock finds a good pivot low above $42 and can start to rally, you could consider buying the stock or working with call options, with short-term upside to about $46.50 per share. From a value standpoint, it’s hard to say that the company’s fundamentals are strong enough to support a continuation of the longer-term upward trend. The stock would need to drop to about $39 before a stronger value argument can be made given the stock’s current fundamental profile.