The completion of Phase One of a U.S.-China trade deal at the beginning of the year put analysts, economists and investors alike in a bullish move about most of the sectors in the market that have anything to do with global trade. Even recent tensions and concerns about the outbreak and potential global spread of coronavirus haven’t kept the market from driving to new highs; but it is interesting that this week a number of companies began citing the virus’ anticipated impact in China, where the outbreak began, as an expected headwind in the weeks and months to come.
One of the industries that I think could be on the “bleeding edge” of that China-based, coronavirus-focused risk is the Auto industry. Analysts generally continue to forecast declining global auto sales through 2020, and that is something that is going to keep pressure on the profitability of not just auto makers, but also the companies that supply them. A number of international companies have been working actively for the last few years to expand their operations into China, where many economists are forecasting the best prospects for growth in a variety of sectors.
BorgWarner Inc. (BWA) is an example of a U.S. company that has been moving to expand its operations aggressively into China. At the beginning of this year, the company also announced it had entered into an agreement to acquire Delphi Technologies, which gives the company exposure and opportunity into hybrid and electronic vehicles, where media buzz and many growth forecasts are the highest. BWA agreed to pay $3.3 billion for the deal, which is a big price, and depending on the analyst, could be an onerous premium to pay to gain entry into this segment. Those two factors, then – coronavirus economic impact in China, along with the high price paid for Delphi – appear to be primary reasons for the company’s almost -19% since the beginning of the year, while the industry at large is up by about 5% over the same period. With the stock dropping near to multiyear lows, does that make the stock a good opportunity to buy cheap, or is it a greater risk than the bargain proposition might suggest? Let’s find out.
Fundamental and Value Profile
BorgWarner Inc. is engaged in providing technology solutions for combustion, hybrid and electric vehicles. The Company’s segments include Engine and Drivetrain. The Engine segment’s products include turbochargers, timing devices and chains, emissions systems and thermal systems. The Engine segment develops and manufactures products for gasoline and diesel engines, and alternative powertrains. The Drivetrain segment’s products include transmission components and systems, all-wheel drive (AWD) torque transfer systems and rotating electrical devices. The Company’s products are manufactured and sold across the world, primarily to original equipment manufacturers (OEMs) of light vehicles (passenger cars, sport-utility vehicles (SUVs), vans and light trucks). The Company’s products are also sold to other OEMs of commercial vehicles (medium-duty trucks, heavy-duty trucks and buses) and off-highway vehicles (agricultural and construction machinery and marine applications. BWA has a current market cap of about $7.2 billion.
Earnings and Sales Growth: Over the last twelve months, earnings decreased a little over -3%, while revenues were flat, but also negative -0.5%. In the last quarter, earnings increased by nearly 22% while sales also improved by about 2.7%. The company’s margin profile shows that Net Income as a percentage of Revenues are healthy, and strengthening somewhat; over the last twelve months this measurement was 7.33%, and 8.59% in the last quarter.
Free Cash Flow: BWA’s free cash flow is healthy and improving, at $527 million. This number does mark a decline from September of 2019, when Free Cash Flow was about $894 million. This also translates to a useful Free Cash Flow Yield of 7.26%.
Debt to Equity: A has a debt/equity ratio of .35. This is a very manageable number, that suggests the company should have no trouble servicing their debt. Their balance sheet shows $832 million in cash and liquid assets against about $1.67 billion in long-term debt. Both of these numbers have also improved since the end of 2018.
Dividend: BWA’s annual divided is $.68 per share and translates to a yield of 1.93% at the stock’s current price.
Price/Book Ratio: there are a lot of ways to measure how much a stock should be worth; but one of the simplest methods that I like uses the stock’s Book Value, which for BWA is $23.47 and translates to a Price/Book ratio of 1.49 at the stock’s current price. Their historical average Price/Book ratio is 2.23, suggesting the stock is currently trading at a discount of almost 50%. That puts the stock’s long-term target price between $52 and $53 per share, which is very attractive given the stock’s current price around $35.
Technical Profile
Here’s a look at the stock’s latest technical chart.
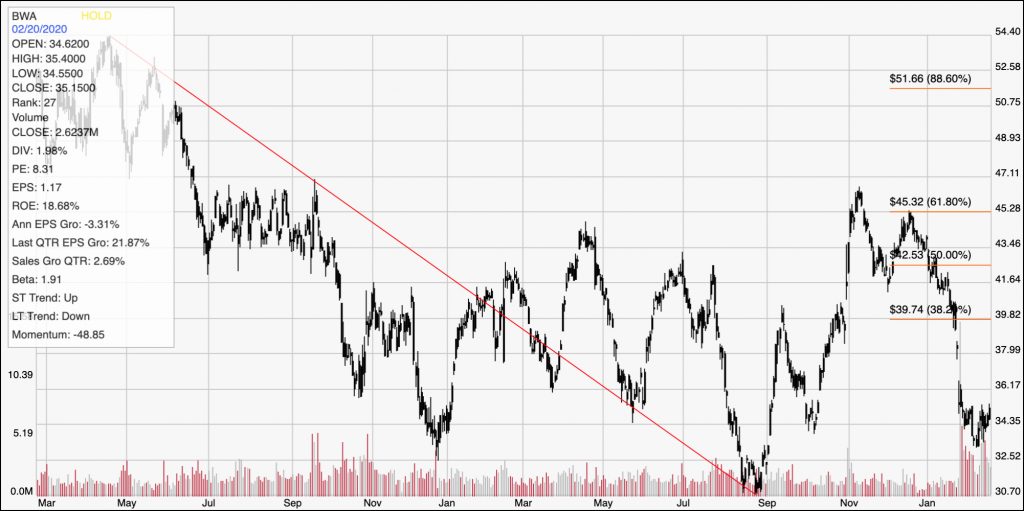
Current Price Action/Trends and Pivots: The red diagonal line measures the length of the stock’s longer-term downward trend over the last two years, and also informs the Fibonacci trend retracement lines shown on the right side of the chart. The stock’s downward trend through 2018 is easy to see, as is its rally from a low point around $31 in late August. The stock pushed above the 61.8% retracement around $45 before dropping back in the last quarter of 2019. In the last month, bearish momentum has really picked up, with a big overnight gap in January following the stock’s last earnings report. Over the last week or so, BWA appears to have found support at around $33 per share, with immediate resistance likely to be at around $36. If it can move above that price, the stock could rally to about $40, where the 38.2% retracement line sits. If the stock drops below support at $36, on the other hand, it could see its bearish momentum push it all the way to its multiyear low around $31.
Near-term Keys: The stock’s current momentum should definitely point a short-term trader to consider bearish opportunities first. If the stock drops below $36, consider shorting the stock or working with put options, with a profit target for a bearish trade at around $31 per share. A good bullish signal would come from a break above resistance at $36; in that case, consider buying the stock or working with call options with an eye on the 38.2% Fibonacci line around $40 as an exit signal. If you don’t mind the idea that the market’s uncertainty in the near-term could translate to some volatility in the stock, the truth is that the fundamentals are solid, and the value proposition is compelling. I think this a stock to keep track of and consider seriously as a useful long-term value opportunity.