Market and popular news media alike has been dominated for the last week or so with headlines about coronavirus. Yesterday morning, before the market opened Jim Cramer even went so far as to render his opinion on air that containment of the virus had been lost – which raises the level of fear and risk not that even if or when effective treatments for the virus are found, the extent of global exposure could be such that economies all over the world will be affected.
At last count, the total number of infected individuals worldwide had exceeded 80,000, with the death toll in China alone above 2,600. That stoked even more fear among investors on Monday, pushing the broad indices down by more than -3% by the market’s close. While many are ringing the gloom and doom bell, others, like Warren Buffett are still generally optimistic in the long-term about the market’s overall prospects. Buffett himself has pointed out that while the U.S. economy has softened, growth remains generally healthy. That begs the question, what is a smart way to keep your money working for you when broad market sentiment is increasingly uncertain, and even fearful?
I think one of the smart things to start doing is to start looking for stocks in defensive-oriented pockets of the economy. For me, Consumer Staples have always made a lot of sense in these kinds of circumstances. While these kinds of stocks aren’t immune from market momentum, and can certainly turn lower with the rest of the market, they also typically display lower volatility characteristics than the most buzz-worthy stocks. General Mills, Inc. (GIS) is a stock that I’ve followed quite some time, and even used on a few different occasions over the last couple of years in my value-based, income-oriented investments. This is a stock that, while still not far away from multiyear highs around $56.50 reached late last year, carries a solid fundamental profile and a better-than-expected value profile. Along with a dividend yield that is well above the average for S&P 500 stocks, I think this is a stock that makes a lot of sense for a careful investor who is looking for conservative to keep their money working.
Fundamental and Value Profile
General Mills, Inc., is a manufacturer and marketer of branded consumer foods and pet food products sold through retail stores. The Company is a supplier of branded and unbranded consumer food products to the North American foodservice and commercial baking industries. It also provides pet food products through its subsidiary Blue Buffalo Pet Products Inc. The Company has four segments: U.S. Retail, International, Pet operating, and Convenience Stores and Foodservice. The Company offers a range of food products with a focus on categories, including ready-to-eat cereal; convenient meals, including meal kits, ethnic meals, pizza, soup, side dish mixes, frozen breakfast and frozen entrees; snacks, including grain, nutrition bars and frozen hot snacks; yogurt, and super-premium ice cream. The Company’s other product categories include baking mixes and ingredients, and refrigerated and frozen dough. It also provides food products for dogs and cats. GIS’s current market cap is $32.5 billion.
Earnings and Sales Growth: Over the last twelve months, earnings increased about 11.75%, while revenues were flat, but slightly positive. In the last quarter, earnings and sales grow both strengthened; earnings increased 20.25%, while sales increased by almost 10.5%. GIS also operates with a healthy margin profile; over the last twelve months, Net Income was 12.6% of Revenues, and strengthened in the last quarter to 13.13%.
Free Cash Flow: GIS’s free cash flow is about $2.4 billion, which is healthy, and translates to a Free Cash Flow Yield of 7.44%.
Dividend Yield: GIS’s dividend is $1.96 per share, and translates to an annual yield of about 3.64% at the stock’s current price.
Debt to Equity: GIS has a debt/equity ratio of 1.37. This is a high number, and is indicative in part of the debt the company assumed to complete the acquisition of Blue Buffalo Pet Foods in 2018. Their balance sheet shows liquidity, which had weakened through most of 2019, has started to improve; in the last quarter, cash and liquid assets were about $560 million. This number was about $532.7 million at the beginning of 2019. They also currently have $10.9 billion of long-term debt. The company’s margin profile indicates that they should have no problem servicing their debt.
Price/Book Ratio: there are a lot of ways to measure how much a stock should be worth; but one of the simplest methods that I like uses the stock’s Book Value, which for GIS is $13.26 per share. That translates to a Price/Book ratio of 4.03, which is high compared to the Price/Book levels I usually look for. Along with its Price/Free Cash Flow ratio, however, the stock is trading at a discount to its historical valuation ratios that put a useful long-term target price nearly 24% above the stock’s current price at a little above $66 per share.
Technical Profile
Here’s a look at the stock’s latest technical chart.
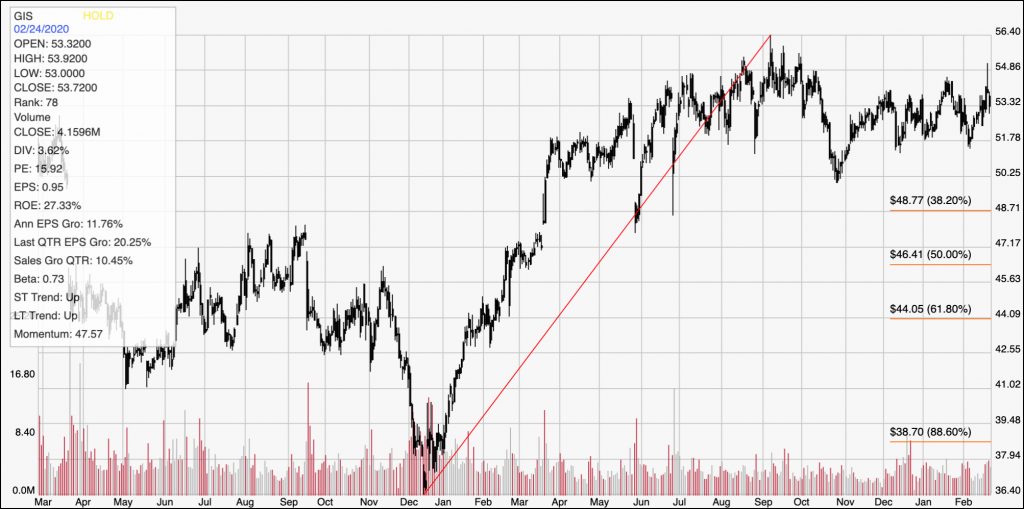
Current Price Action/Trends and Pivots: This chart traces the stock’s movement over the last two years. The stock’s rally from the bottom of the trend to a peak at about $56.50 in September 2019 is impressive; from that point, the stock retraced a bit in October before beginning to consolidate in a tight, sideways trend with resistance at about $54 and support at about $51.75. If the stock can break above $54, it has immediate, limited upside to $56 before its next resistance; but a push above $56.50 could give the stock enough momentum to carry even higher, and possibly test the $66 range my value analysis suggests. A break below $51.75 could give the stock enough bearish momentum to test its next support near pivot lows in June of last year at around $48 – near the 38.2% Fibonacci retracement line.
Near-term Keys: If you’re looking for a short-term, bullish trade, I think immediate upside in GIS could be limited given current market conditions; however, if the stock does break above $56.50, it could offer some interesting opportunities to buy the stock or work with call options with an eye on exit targets anywhere between $60 and $66, depending on the time frame you want to work with. A push below support at $51, on the other hand, would be a good signal to consider shorting the stock or working with put options, with an eye on the 38.2% Fibonacci retracement line around $48 as a bearish profit target. The stock’s value proposition remains compelling, even with the stock’s increase since the beginning of 2019, and with a healthy dividend, there is a strong argument to make for using the stock as a useful long-term position.