As fears about the potential failure of coronavirus containment, in the U.S., Europe, and other areas outside of China have increased, the market appears to have begun moving into free-fall. In the last two days, the Dow has shed nearly 2,000 points – enough to push that index down by more than -8.5% since forming its latest top a couple of weeks ago. That’s in legitimate correction territory, and it’s a bearish push that has bled over into multiple sectors, including the Tech sector, which is down a little more than -9% in the last week.
The bearish pressure on the market, and the sector is something that has started to affect a lot of names in the sector, including Xerox Corporation (XRX). In 2019, XRX was one of the top performers in the market, more than doubling in price before topping in December. The stock is only about -7% below that high now, but current market momentum could translate to higher downside risk. 2019 was driven by material improvements in the stock’s fundamental profile.
At the end of the year, the company announced plans to acquire Hewlett Packard (HPQ). HPQ refused the offer multiple times; however this week reports surfaced that HPQ might be considering the reverse; the company reported it “is reaching out to Xerox to explore if there is a combination that creates value for HP shareholders that is additive to HP’s strategic and financial plan.” Is that something that could offer an interesting opportunity now? Let’s try to find out.
Fundamental and Value Profile
Xerox Corporation is a provider of digital print technology and related solutions. The Company has capabilities in imaging and printing, data analytics, and the development of secure and automated solutions to help customers improve productivity. The Company’s primary offerings span three main areas: Managed Document Services, Workplace Solutions and Graphic Communications. Its Managed Document Services offerings help customers, ranging from small businesses to global enterprises, optimize their printing and related document workflow and business processes. Managed Document Services includes the document outsourcing business, as well as a set of communication and marketing solutions. The Company’s Workplace Solutions and Graphic Communications products and solutions support the work processes of its customers by providing them with printing and communications infrastructure. XRX’s current market cap is about $7.8 billion.
Earnings and Sales Growth: Over the last twelve months, earnings increased more than 16.67%, while sales decreased by -3.5%. In the last quarter, earnings improved by 23% while revenues improved by 11%. XRX operates with a healthy, strengthening margin profile; Net Income versus Revenues over the past year was 14.8%, and increased in the last quarter to 33.4%.
Free Cash Flow: XRX’s free cash flow is healthy, at a little more than $922 million. That translates to an attractive Free Cash Flow Yield of about 17.1%. It is also worth noting that XRX’s Free Cash Flow was $0 in June of 2018, with the company showing consistent improvement in this critical metric from that point.
Debt to Equity: XRX has a debt/equity ratio of .58. That’s generally a conservative number that reflects management’s approach to debt management. Since the beginning of 2018, the company’s long-term debt has decreased from a little more than $5.2 billion to its current level of $3.2 billion. Their balance sheet also shows $922 million in cash and liquid assets.
Dividend: XRX pays a dividend of $1.00 per share, which translates to an annual yield of 2.74% at the stock’s current price.
Price/Book Ratio: there are a lot of ways to measure how much a stock should be worth; but I like to worth with a combination of Price/Book and Price/Cash Flow analysis. Together, these measurements provide a long-term target at about $38.13 per share. That’s a modest increase that suggests the stock is fairly valued. It also puts a bargain-level price at around $30.50 per share – more than -16% below the stock’s current price.
Technical Profile
Here’s a look at the stock’s latest technical chart.
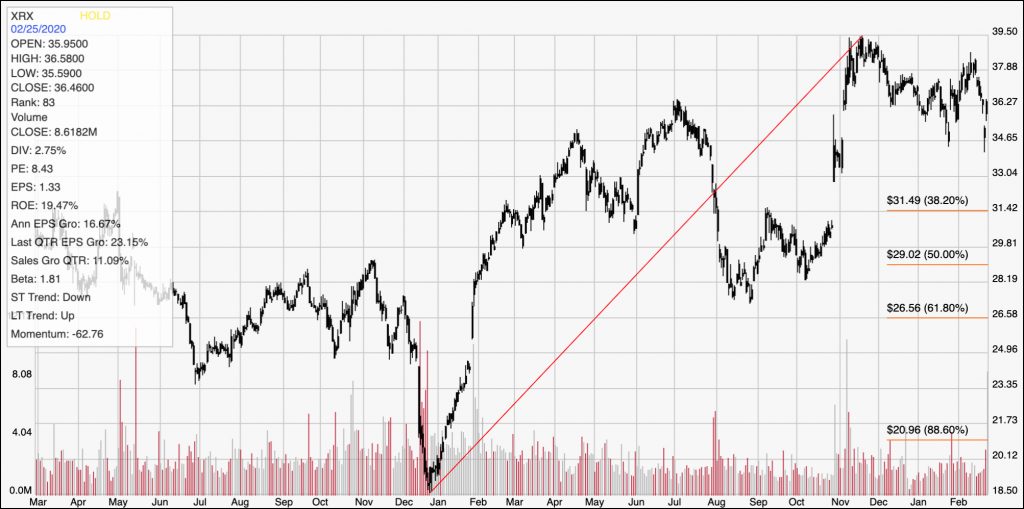
Current Price Action/Trends and Pivots: The diagonal red line traces the stock’s upward trend from the end of 2018 to its peak at about $39.50 in mid-November. It also provides the baseline used to calculate the Fibonacci retracement lines shown on the right side of the chart. The stock is about -7% below that high, with current momentum clearly on the bearish side. That momentum has increased in the last week, with the stock sitting right at support at around $36.50 per share. A push below that level could lead to additional short-term downside risk to next support at the 38.2% Fibonacci line at $31.50 per share. The stock has current resistance at around $38 per share, and would need to break above that level to reconfirm the current upward trend, with more potential upside to about $44 per share.
Near-term Keys: XRX is a stock with a solid fundamental profile, but at its current price, it’s hard to argue the stock offers a strong value proposition. The stock’s bearish momentum may be discouraging for a bullish investor, but if the stock breaks support at $36.50, it could act as a good signal to consider shorting the stock or working put options, with an eye on $31.50 as a profit target. If the stock can reverse its momentum, a push above $38 per share could give the stock momentum to rally to about $44, which could offer a good opportunity for a growth investor to buy the stock or even to work with call options. From a value standpoint, I think the smart approach is to be patient; the stock’s current bearish momentum could provide a useful value entry point in the $31 range.