In the last week, uncertainty and concern related to the increasing spread of coronavirus on a wider, global basis (including the U.S., on a relatively smaller scale) officially gave way to panic; for the week, the Dow Jones Industrial average shed more than 4,000 points from its last peak in the middle of February, which puts it nearly -14% lower from that point. The biggest portion of the drop came in the last five trading sessions, as traders started selling in a way that hasn’t been seen since the beginning of the last bear market nearly 12 years ago. All of the major indices are officially in correction territory, which naturally leads a lot of people to start using scarier words like bear market or, even worse, recession.
The truth is that during the stage where fear yields to panic, there aren’t a lot of places to hide in the stock market. Just about every sector has been affected, including those that are generally considered to be safe havens, like Consumer Staples and even utilities. As measured by the S&P 500 Utilities Sector SPDR (ETF), utility stocks have dropped about -12% – a little less than the broad market, but well off the pace of some of the most dramatically affected sectors like Technology.
The news about coronavirus hasn’t really gotten better over the weekend; the first two coronavirus-connected deaths in the U.S. were reported in the Washington area, and criticism is mounting about the effectiveness of the CDC’s (and, consequently, the Trump administration’s) response and level of preparation to test, contain and ultimately treat the virus. News headlines in the U.S. were also marked by what I perceive as media-fed frenzy on the consumer level, as retailers reported massive runs on basic goods like bottled water, toilet paper and hand sanitizer. That appears to be setting the stage for another turbulent week. That means that the market could keep dropping in the near future, and even test bear market levels for the second time since bottoming at close to a -20% decline in late 2019.
Increasingly uncertain conditions in the broad market often means that stocks like Southern Co. (SO) start to look a lot more attractive. From a value-based perspective, SO might be overvalued; after all, the stock is up about 40% over the last fourteen months, rising from a December 2018 low around $42.50 to its current price a little above $60 per share. In the last three weeks, however, the stock has followed the broader market about -15% lower, so it has hardly been immune from the wave of fear and even panic that is gripping the market right now. Even so, this a utility company with a solid, stable fundamental profile, healthy cash flow and a strong dividend offering a useful passive income. Does that mean you should use the stock to keep your money working for you? Let’s run the numbers so you can decide for yourself.
Fundamental and Value Profile
The Southern Company (Southern Company) is a holding company. The Company owns all of the stock of the traditional electric operating companies and the parent entities of Southern Power Company (Southern Power) and Southern Company Gas, and owns other direct and indirect subsidiaries. The Company’s segments include Gas distribution operations, Gas marketing services, Wholesale gas services, Gas midstream operations and All other. The Gas distribution operations segment includes natural gas local distribution utilities that construct, manage, and maintain intrastate natural gas pipelines and gas distribution facilities in seven states. The Gas marketing services segment provides natural gas commodity and related services to customers markets that provide for customer choice. The Wholesale gas services segment engages in natural gas storage and gas pipeline arbitrage. The Gas midstream operations consist primarily of gas pipeline investments, with storage and fuels. SO’s current market cap is about $63.6 billion.
Earnings and Sales Growth: Over the last twelve months, earnings increased by 8%, while sales decreased by nearly -8%. In the last quarter, earnings dropped by almost -80% while revenues slid -18% lower. SO operates with a strong, operating profile that has narrowed sharply in the last quarter; over the last twelve months Net Income was 22% of Revenues and 9.05% in the last quarter.
Free Cash Flow: SO’s free cash flow is healthy, at a little more than $3.34 billion. That translates to a useful Free Cash Flow Yield of about 5.28%. It is also worth noting that SO’s Free Cash Flow was about $6 billion in June of last year.
Debt to Equity: SO has a debt/equity ratio of 1.37. That’s a high number that is a good indication of SO’s high leverage; but it also isn’t all that unusual for stocks in the Utility sector. Their balance sheet in the last quarter shows $11.975 billion in cash and liquid assets (down from about $2.9 billion in the quarter prior) versus $43.4 billion in long-term debt.
Dividend: SO pays a dividend of $2.48 per share, which translates to an annual yield of about 4.11% at the stock’s current price.
Price/Book Ratio: there are a lot of ways to measure how much a stock should be worth; but like to work with a combination of Price/Book and Price/Cash Flow analysis. Together, these measurements provide a long-term, fair value target at about $75 per share. That means the stock is trading at an interesting discount, with 25% upside from the stock’s current price.
Technical Profile
Here’s a look at the stock’s latest technical chart.
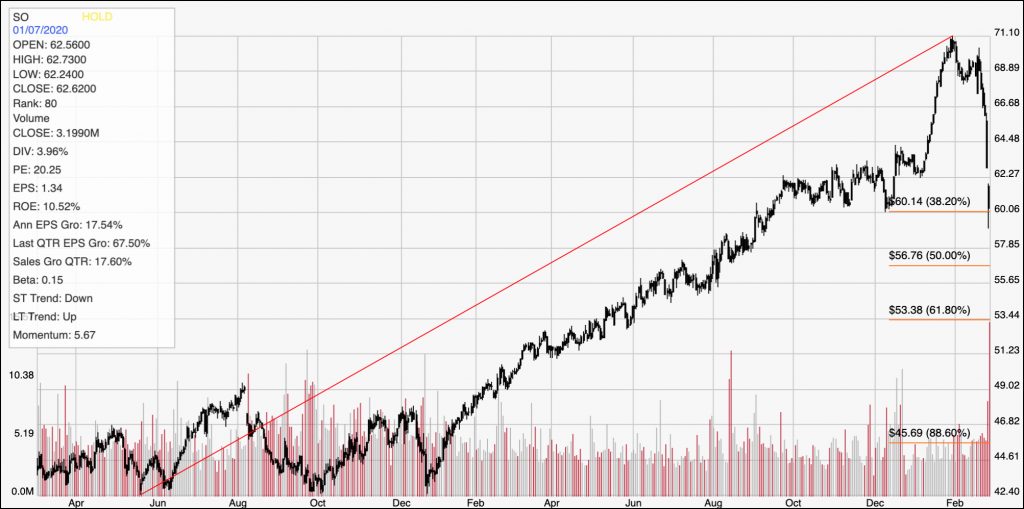
Current Price Action/Trends and Pivots: The diagonal red line traces the stock’s upward trend from June of 2018 to its peak at about $71.10 at the end of January. It also provides the baseline used to calculate the Fibonacci retracement lines shown on the right side of the chart. SO’s momentum is clearly bearish, and has accelerated in the last week, pushing the stock right on top of the 38.2% Fibonacci retracement line around $60 per share. This week will provide a good indication whether $60 will act as a useful support level; if it doesn’t, the stock could drop to a level between the 50% and 61.8% retracement lines, which are between $53 and $57 per share. If, somehow the stock does manage to find support around its current level and see an increase in buying activity, it could see short-term upside to about $64.50, marked by pivot highs in the early part of December 2019. If the stock can break above that level, it could retest its multiyear high at around $71 per share.
Near-term Keys: SO is a stock with a solid fundamental profile, and with a value profile that I think is becoming more and more interesting. Given the current state of market sentiment (nee fear), I think the smart thing for a long-term, value-oriented investor might be to wait to see if the stock does start to stabilize. If it keeps dropping lower, the value proposition will be even better, and if it starts to reverse higher, it could offer a good entry point anywhere between the stock’s current price and $57 per share. If you prefer to work with short-term trading strategies, a drop below $60 would be a good signal to consider shorting the stock, with $57 acting as a good, quick-hit exit point. The best probability on the bullish side won’t really come unless the stock can break above immediate resistance at $64.50. That would be a useful signal to consider buying the stock or working call options with an eye on the stock’s January peak at around $71.