Just a few weeks ago – as concern about COVID-19 was rising, but hadn’t quite reached the panic stage that officially propelled the market into the first bear market in more than a decade – I profiled Tyson Foods Inc. (TSN) as a stock you should be watching. At the time, the stock had declined about -38% from its high in December of last year. The stock actually dropped from that point even further, to a low around $42.50 per share – a decline of almost -55% from that peak – before rebounding back near to the level it was at when I wrote about it earlier this month.
TSN is a globally positioned company that I think fits into a useful, defensive niche. The Food Products industry has proven to be a pocket of the market this month that investors have taken interest in, as social distancing and self-isolation have become more and more necessary. That has prompted consumers to put a lot of attention on making sure they have enough basic supplies at home to get through the foreseeable future. I think that has played a big role in TSN’s short-term rebound, but it should also help the industry continue to stand out in the longer-term. U.S. Protein producers with a global footprint have an even more interesting niche to me. China appears to slowly be starting to get back to business. Not only do they have to deal with recovering from COVID-19, but also from a national protein shortage resulting from swine flu. That means companies like TSN should have a competitive advantage.
Fundamental and Value Profile
Tyson Foods, Inc. is a food company, which is engaged in offering chicken, beef and pork, as well as prepared foods. The Company offers food products under Tyson, Jimmy Dean, Hillshire Farm, Sara Lee, Ball Park, Wright, Aidells and State Fair brands. The Company operates through four segments: Chicken, Beef, Pork and Prepared Foods. It operates a vertically integrated chicken production process, which consists of breeding stock, contract growers, feed production, processing, further-processing, marketing and transportation of chicken and related allied products, including animal and pet food ingredients. Through its subsidiary, Cobb-Vantress, Inc. (Cobb), the Company is engaged in supplying poultry breeding stock across the world. It produces a range of fresh, frozen and refrigerated food products. Its products are marketed and sold by its sales staff to grocery retailers, grocery wholesalers, meat distributors, warehouse club stores and military commissaries, among others. TSN has a current market cap of $21.5 billion.
Earnings and Sales Growth: Over the last twelve months, earnings improved by 5%, while sales grew a little over 6%. In the last quarter, earnings increased by 37% while sales were flat, but slightly negative at -0.63%. TSN operates with a modest margin profile that appears to be strengthening; in the last twelve months, Net Income was 4.71% of Revenues and increased to 5.15% in the last quarter.
Free Cash Flow: TSN’ Free Cash Flow is generally healthy, at almost $1.3 billion. That number has decreased from about $1.9 billion in June of 2018. Its current level translates to a Free Cash Flow yield of about 5.61%.
Debt to Equity: TSN has a debt/equity ratio of .67, which is pretty conservative. Cash and liquid assets increased from about $170 million in June of 2018 to almost $500 million in the last quarter. The increase is a positive sign, but TSN also carries about $9.77 billion in long-term debt, which means that liquidity could be an issue in the event of a shortfall in company’s operating profits. For now, however for now their balance sheet indicates operating profits are more than sufficient to service their debt.
Dividend: TSN pays an annual dividend of $1.68 per share, which at its current price translates to a dividend yield of 2.68%. TSN’s dividend has also increased from $1.20 per share in late 2018.
Price/Book Ratio: there are a lot of ways to measure how much a stock should be worth; but I like to work with a combination of Price/Book and Price/Cash Flow analysis. Together, these measurements provide a long-term, fair value target around $70 per share. That means the stock is nicely undervalued, with 22% upside from the its current price.
Technical Profile
Here’s a look at the stock’s latest technical chart.
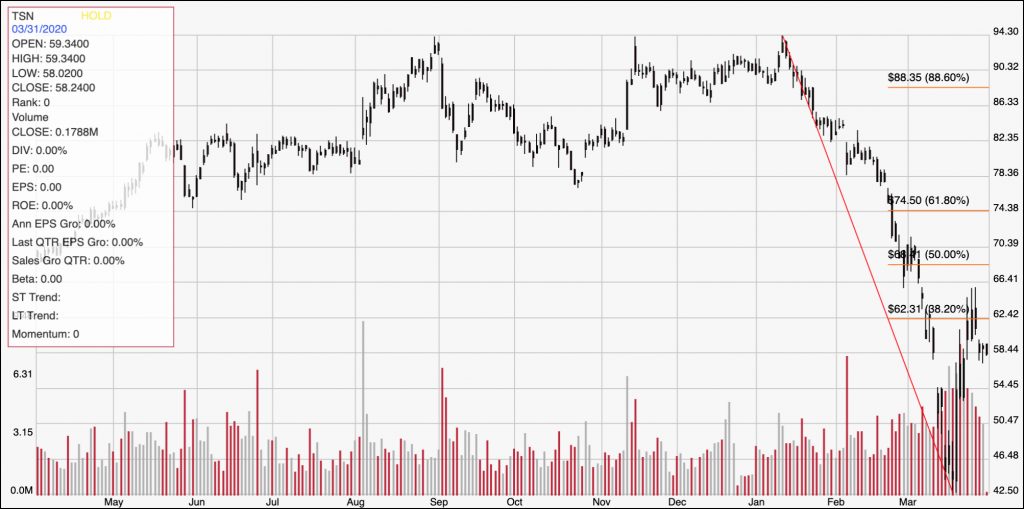
Current Price Action/Trends and Pivots: The diagonal red line outlines the stock’s downward trend from mid-January to its low a little over a week ago around $42.50; it also provides the baseline for the Fibonacci retracement levels shown on the right side of the chart. From that low point, the stock rebounded to the 38.2% retracement line at about $62.50 per share. The stock has come down a bit from that level, but appears to be showing support around $58 per share. A drop below $58 could see TSN drop to about $54 as a near-term support level, with further downside to about $42.50 if bearish momentum continues. A push back above $62.50 could provide bullish upside anywhere between $69 and $74.50 per share.
Near-term Keys: TSN’s recent rally is a useful, near-term technical indication that it could be consolidating, and which I think offers near-term support for the stock’s solid value proposition. If you prefer to work with short-term trading strategies, a push above $62.50 would act as a good signal to buy the stock or to work with call options, with an eye on $69 to $74.50 per share as a useful bullish target. A drop below $58, on the other hand should be taken as a signal to consider shorting the stock or buying put options, using $54 as a good near-term bearish target, or possibly even $42.50 below that point if bearish momentum continues.