One of the ironies of the stock market right now is that if you look at the major market indices, it’s easy to say that, right or wrong, investors are anticipating a V-shaped recovery in the U.S. economy. That’s the hope that, while the impact of COVID-19 on virtually every sector in the economy has been rapid and dramatic, the much-anticipated and hoped-for recovery might be proportional to the decline.
The irony comes when you start to dissect the market movers from the laggards. It isn’t that surprising to see that most of the strongest stocks in the market since mid-March are among the largest, most easily recognized names in the American economy. These are companies that don’t just carry name-brand cachet but also have the resources, reflected in their balance sheets by healthy cash positions and limited debt, to ride through current economic difficulties that truthfully are forcing companies in every sector, and of every conceivable size and make up, to scrutinize their operations in the most critical terms, and take actions to ensure the business’ survival in the uncertain weeks and months to come.
Many of the laggards – the stocks whose price patterns haven’t matched, or have possibly even diverged from the broad index trend for the last two months are smaller, less recognizable names. The size of these companies doesn’t automatically imply weaker or less disciplined management than their larger brethren; in most cases, it just means that their specialization may be narrower than the industry leaders, or that their target market may have a smaller global footprint. That may or may not put them at a disadvantage during an economic downturn; but it is a reason that a lot of investors tend to shy away from those stocks during economically uncertain time periods.
This dichotomy between industry or sector leaders and smaller, less established companies can be seen pretty easily in the Heavy Machinery industry of the Industrial sector. The largest companies in the sector – Caterpillar Inc. (CAT) and Deere & Co. (DE), for example – saw a healthy bounce along with the rest of the market from mid-March into April, with the entire sector mostly consolidating from the April high into a narrow range that has technical investors sitting in wait-and-see mode. In the meantime, smaller competitors, like Terex Corp (TEX) failed to rally, instead holding near multi-year lows.
I think some of that action in these smaller companies comes from measures management may have to take to preserve capital and retain financial flexibility that larger companies may not have to take. In the case of TEX, slowdowns associated with the coronavirus pandemic prompted management to announce a suspension of its dividend in its latest earnings report, along with employee furloughs and reduced salaries for executives. The company’s earnings and Net Income both reflect a significant impact from nationwide shutdowns and shelter-in-place orders; at the same time, their balance sheet remains strong enough given their size to give them the financial stability and flexibility they need to ride through the current crisis, however long it lasts. While the stock failed to follow its bigger brethren higher from March to April, it is also consolidating in a narrow trading range near those multiyear lows. That could be an interesting, leading technical indicator for a contrarian investor, along with a bargain proposition that a dyed-in-the-wool value and fundamental investor might find too compelling to pass up.
Fundamental and Value Profile
Terex Corporation is a manufacturer of lifting and material processing products and services that deliver lifecycle solutions. The Company has three business segments: Aerial Work Platforms (AWP), Cranes and Materials Processing (MP). It delivers lifecycle solutions to a range of industries, including the construction, infrastructure, manufacturing, shipping, utility, quarrying and mining industries. The AWP segment designs, manufactures, services and markets aerial work platform equipment, telehandlers and light towers. The AWP segment’s products are used by its customers to construct and maintain industrial, commercial and residential buildings and facilities, and for other commercial operations, as well as in a range of infrastructure projects. The Cranes segment’s products are used by its customers for construction and manufacturing facilities, among others. The MP segment’s products are used by its customers in construction, infrastructure and recycling projects. TEX’s current market cap is $981.3 million.
Earnings and Sales Growth: Over the last twelve months, earnings plunged more than -140% while revenues declined about -26.5%. In the last quarter, the decline in earnings accelerated to a little more than -197%, while sales decreased -5.8%. TEX operates with a narrow margin profile that turned negative in the most recent quarter. In the last twelve months, Net Income was 2.35% of Revenues, but slid backwards to -2.99% in the last quarter. Narrow margins are not unusual in the Heavy Machinery industry, and given the nationwide shutdown of business operations from COVID-19, the negative Net Income pattern may not be surprising, but it is nonetheless a source of concern as it does act as a drag on the company’s balance sheet for as long as it persists.
Free Cash Flow: TEX’s free cash flow is healthy, at a bit over $231 million that does mark an increase over the last year; in March of 2019, Free Cash Flow was -$204 million. It also translates to an interesting Free Cash Flow Yield of more than 25%. It should be noted that the company’s last earnings report was as of the end of March, which means that full impact of government-imposed restrictions has yet to truly be seen on TEX’ balance sheet.
Debt to Equity: TEX has a debt/equity ratio of 1.7. That number implies a high level of leverage, which of itself isn’t particularly alarming in the Heavy Machinery industry. Their balance sheet shows $535 million in cash and liquid assets against about $1.1 billion in long-term debt.
Dividend: TEX suspended its dividend during its last earnings report. It is unknown when or if the dividend might be reinstated; in the report management stated their dividend would be suspended for the remainder of 2020 but provided no additional details.
Price/Book Ratio: there are a lot of ways to measure how much a stock should be worth; but I like to work with a combination of Price/Book and Price/Cash Flow analysis. Together, these measurements provide a long-term, fair value target at about $24 per share. That means the stock is trading at a steep discount, with 68% upside from the stock’s current price.
Technical Profile
Here’s a look at the stock’s latest technical chart.
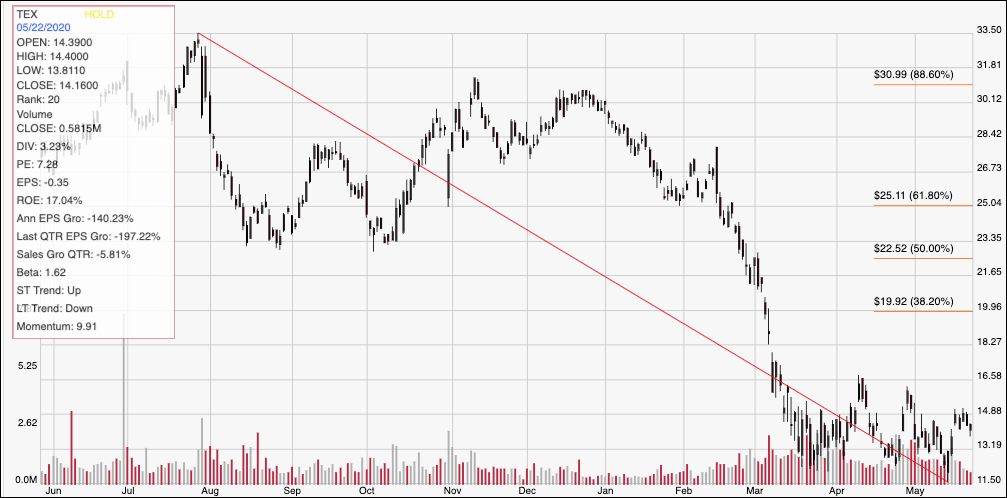
Current Price Action/Trends and Pivots: The red diagonal line measures the length of the stock’s downward trend from July of last year to its lowest point earlier this month. It also provides the baseline for the Fibonacci retracement levels shown on the right side of the chart. After hitting a low around $11.50 in mid-March, the stock began to establish a narrow consolidation range, with resistance sitting around $15 per share, and support at $11.50. If the stock drops below $11.50, it could fall to somewhere between $8 and $9 per share – lows it last saw in 2009. On the other hand, a push above $15 could give the stock momentum to drive to nearly $20, where the 38.2% Fibonacci retracement line rests.
Near-term Keys: While the value proposition for TEX is compelling, I think there are enough questions right now about the true impact of COVID-19 on the company’s balance sheet to be wary. The next quarter or two will provide a better basis to determine if this stock’s fundamentals are strong enough to support its bargain argument; until then, I would hold off on taking a long-term position in this stock. That said, it could offer some interesting short-term opportunities if the stock can break out of its current consolidation pattern. A push above $15 could be a very interesting bullish signal to buy the stock or work with call options, using $19 to $20 as a very attractive profit target. A drop below $11.50 could also act as a useful signal to consider shorting the stock or buying put options, with a target price somewhere between $8 and $9 on a bearish trade.