Markets are naturally cyclical – they swing from high to low and back again on a consistent, if unpredictable basis over a range of time frames. The different time periods associated with any given cycle, or sometimes even the depth of a certain cycle’s direction, can shade the casual investor’s perception about a stock’s opportunity. The most recent bull market, which extended itself over a more than ten-year time period is good example; because of both the unprecedented time period that market’s bullish run covered, and even more particularly the higher-than-average runs that run covered during its last couple of years, a lot of the average investors made the mistake of assuming that the market would simply continue that run.
We’re almost halfway through 2020 now, and my how things have changed. The global COVID-19 pandemic shut down practically the entire global economy as governments in almost every country imposed strict quarantine and shelter-in-place restrictions in the early part of the year. That prompted stock markets around the world to plunge into strongly bear market territory in record time; the S&P 500, for example, plunged more than -35% in just about a one-week length of time. That slide downward coincided with broad-based concerns not only about how long the pandemic would last, but also how long we would all be forced to follow those restrictive, self-isolation guideline.
Most of this month has seen countries, including the United States beginning to lift those restrictions to enable economic activity to begin again, even as it has become clear that the pandemic isn’t going to simply become a thing of the past. It looks more and more like we are going to simply have to get used to living in a world where coronavirus remains a threat and a concern – especially since even the most optimistic medical and scientific professionals in the world aren’t expecting to see any practical vaccines until 2021 at the absolute earliest, and very possibly until 2022. Even anti-viral treatments, which can be used to treat the worst symptoms to help infected patients battle through the virus are not expected to be available in a practical sense until next year.
The market has rebounded strongly from that late March, bear-market bottom, as investors are clearly enthusiastic about the prospects of seeing the economy resume activity, even a gradual basis. That has sent a lot of sectors higher as well, with a wide range of stock reclaiming as much as 50% of their recent declines. That makes the market tempting fodder to start assuming that the good times are back again – but as I just mentioned, there are a lot of risks that remain. That doesn’t mean you should be bearish on the market right now – but you should absolutely be very cautious about taking on new positions. Don’t simply assume that a stock is a bargain just because it is still significantly below its pre-pandemic high.
Oshkosh Corporation (OSK) is a good example of what I mean. The stock dropped more than -50% below its highest point around $95, with the lion’s share of that decline coming as global coronavirus fears took hold. From its own bear market bottom, the stock has rallied a little over 50% higher, but still remains about -30% below that previous high. The stock’s recent strength might prompt you to assume that the bear market is done, and with the stock still trading at a significant discount from that high around $95, there is plenty of upside waiting for you to claim. This is where it becomes important to evaluate the strength of the stock’s underlying business; are OSK’s fundamentals strong enough to make the value proposition worthwhile?
Fundamental and Value Profile
Oshkosh Corporation (OSK) is a designer, manufacturer and marketer of a range of specialty vehicles and vehicle bodies, including access equipment, defense trucks and trailers, fire and emergency vehicles, concrete mixers and refuse collection vehicles. The Company’s segments include Access Equipment; Defense; Fire & Emergency, and Commercial. The Access Equipment segment consists of the operations of JLG Industries, Inc. (JLG) and JerrDan Corporation (JerrDan). The Defense segment consists of the operations of Oshkosh Defense, LLC (Oshkosh Defense). The Fire & Emergency segment consists of the operations of Pierce Manufacturing Inc. (Pierce), Oshkosh Airport Products, LLC (Airport Products) and Kewaunee Fabrications LLC (Kewaunee). The Commercial segment includes the operations of Concrete Equipment Company, Inc. (CON-E-CO), London Machinery Inc. (London), Iowa Mold Tooling Co., Inc. (IMT) and Oshkosh Commercial Products, LLC (Oshkosh Commercial). OSK has a current market cap of about $4.8 billion.
Earnings and Sales Growth: Over the last twelve months, earnings declined by -31%, while revenues decreased almost -10%. In the last quarter, earnings increased by 13.6% while sales rose about 6%. The company operates with an operating margin that has historically been stable, but is, not surprisingly showing signs of deterioration; over the last twelve months, Net Income was about 6.76% of Revenues, but declined in the last quarter, to 3.71%.
Free Cash Flow: OSK’s free cash flow is adequate, at about $308.5 million. This number marks a significant improvement from the middle of 2019, from around $205 million, but is also below its level at the end of 2019, when it was around $400 million.
Dividend: OSK’s annual divided is $1.20 per share, which translates to a yield of about 1.83% at the stock’s current price. That also marks an increase from $.96 per share, per annum around the middle of 2018.
Price/Book Ratio: there are a lot of ways to measure how much a stock should be worth; but I like to work with a combination of Price/Book and Price/Cash Flow analysis. Together, these measurements provide a long-term, fair value target at about $92 per share. That means the stock is trading at a useful discount, with 31% upside from the stock’s current price.
Technical Profile
Here’s a look at the stock’s latest technical chart.
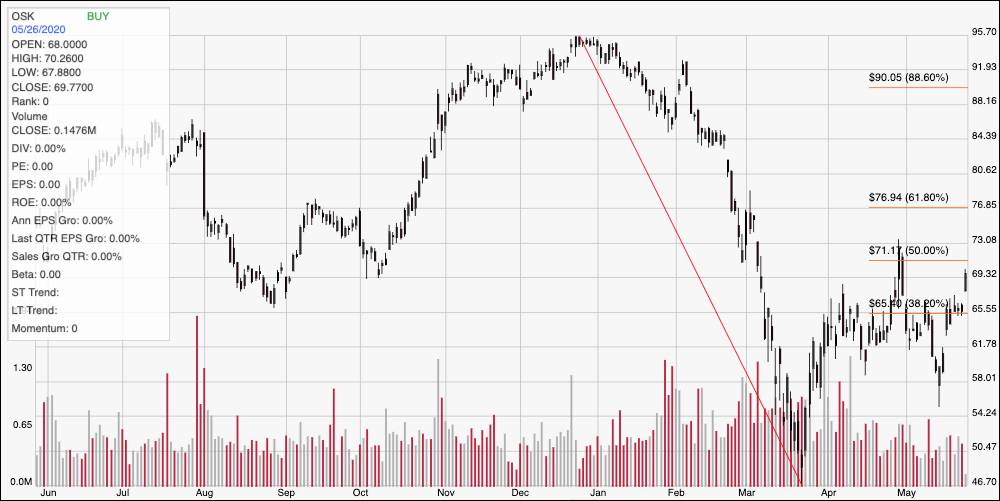
Current Price Action/Trends and Pivots: The red diagonal line measures the length of the stock’s downward trend from its peak at around $95 at the beginning of the year to its low in March at around $47; it also informs the Fibonacci trend retracement lines shown on the right side of the chart. The stock rallied strongly into the early part of April, but then settled into a narrow range, like many stocks in the Heavy Machinery industry, with $60 providing useful support and resistance sitting at around $66. The stock appears to be breaking above that resistance level now, with immediate resistance a little above $71. A push to $71.50 would mark a confirmation of today’s momentum as well as a break above that next resistance, with additional upside to about $77 where the 61.8% Fibonacci retracement level sits. A drop below previous resistance at around $66, and which should now provide support, could see a quick drop back to around $60.
Near-term Keys: OSK’s value proposition looks very interesting right now, and for the most part the company’s balance sheet remains healthy and in better shape than many other companies dealing with the reality of pandemic-imposed shutdowns. That said, the last earnings report only reflected numbers as of the end of March, meaning that the full effect of global restrictions has yet to be truly seen in the company’s fundamental numbers. That means that I’m not ready to buy OSK’s value proposition just yet. The stock does have some interesting possibilities for short-term trades, however; watch for a break above $71 as a strong signal to consider buying the stock or working with call options, using $77 as an effective short-term profit target. A drop back below $66 could act as a good signal to consider shorting the stock or buying put options, with $60 providing a useful bearish profit target.