Coming out of the Memorial Day holiday, and looking over the last couple of weeks, investors seem eager to bet on a continued recovery in the U.S. and global economy, and that has meant the bullish sentiment that pushed a number of stocks off of March, bear-market lows has gotten a fresh new push. Investors seem to working off of the idea that, even if business isn’t entirely back to pre-pandemic normal, anything better than shutdown, recessionary or possibly even depressive conditions is something to cheer about.
The advent of spring means a lot of things, in a number of different ways. For consumers, it usually means pulling out the yard tools and getting started with home improvement projects. The early part of this year’s spring, not surprisingly was largely muted by the reality of global shutdowns, quarantines, and self-isolation restrictions. Rising unemployment that today stands at around 38 million unemployed workers also promises to be a headwind for companies whose businesses rely on the transition from winter to warmer months across the country. That means that for investors interested in the industries that service this segment of the economy, there is a real premium to a company’s balance sheet right now.
The Toro Company (TTC) is a case in point. This is a company that makes a lot of the brands you probably associate with home and yard maintenance, including Toro (mowers, blowers, trimmers), Lawn-Boy and Lawn Genie (sprinkler heads and valves, irrigation systems for residential and commercial landscapes). The market clearly seems to be betting on a healthy spring for the stock, having pushed it a little more than 12% higher in just the last two weeks. It’s breaking out above what looks like s significant resistance level right now and building bullish momentum; but there are some things to look out for on the fundamental side of things.
The company’s last earnings report was as of the end of January – before any impact from COVID-19 on companies in the U.S. was really being anticipated in a material sense. Their next report is due in the first week of June, providing the first real look at what has happened to their business since the pandemic took effect. In the meantime, management has withdrawn any forward-looking guidance through the rest of 2020; at the end of April, they also revealed drastic cost-cutting efforts, including reduced compensation for all executive officers, managers, and exempt (salaried) employees, and a reduced workweek for hourly employees. Those cuts will also extend through the end of 2020. As of the last quarter, the company’s balance sheet showed generally manageable levels of debt and generally healthy operating margins; but given the drastic measures taken, you can’t help but wonder if their next earnings report won’t reveal that things have deteriorated even more than expected. That could mean that the stock’s recent impressive rally could be based on nothing more than sentiment and momentum, with lots of downside risk when reality checks in. Let’s dive in.
Fundamental and Value Profile
The Toro Company (Toro) is engaged in the designing, manufacturing, and marketing of professional turf maintenance equipment and services, turf irrigation systems, landscaping equipment and lighting products, snow and ice management products, agricultural micro-irrigation systems, rental and specialty construction equipment, and residential yard and snow thrower products. The Company operates through three segments: Professional, Residential and Distribution. Under the Professional segment, Toro designs professional turf, landscape and lighting, rental and specialty construction, snow and ice management, and agricultural products. The Residential segment provides products, such as riding products, home solutions products and snow thrower products. It manufactures and markets various walk power mower models. The Distribution segment consists of Company-owned domestic distributorship. Its brands include Toro, Exmark, BOSS, Irritrol, Hayter, Pope, Unique Lighting Systems and Lawn-Boy. TTC’s current market cap is $7.4 billion.
Earnings and Sales Growth: As of January, earnings grew almost 11.5% in the prior twelve months, while revenues improved 27%. In the most recent quarter, earnings grew more than 33% while revenues rose about 4.5%. TTC’s operating profile appears healthy, with Net Income running at 8% of revenues in the trailing twelve-month period, and increasing to 9.13% in the last quarter. This last measurement – Net Income as a percentage of Revenues – will be a telling metric to focus on in the company’s next report to determine if conditions have deteriorated significantly.
Free Cash Flow: TTC’s free cash flow is modes, at a little more than $202 million and translates to a Free Cash Flow Yield of 3.1%.
Debt to Equity: TTC has a debt/equity ratio of .66, which generally conservative. Their balance sheet shows about $109 million in cash and liquid assets versus about $601 million in long-term debt. The red flag here comes from the reality that in the last year, even before COVID-19 became a concern, cash had dropped by more than -50%, while debt almost doubled. A material deterioration in the company’s margin profile could put even more pressure on their balance sheet and may cast some of the cost-cutting measures I already mentioned into a clearer, albeit more troublesome light.
Dividend: TTC pays an annual dividend of $1.00 per share, which translates to a yield of about 1.48% at the stock’s current price.
Price/Book Ratio: there are a lot of ways to measure how much a stock should be worth; but I like to work with a combination of Price/Book and Price/Cash Flow analysis. Together, these measurements provide a long-term, fair value target at about $67.53 per share. That means the stock is trading a little above that fair value, and is about -17% above the stock’s actual bargain price at around $54.
Technical Profile
Here’s a look at the stock’s latest technical chart.
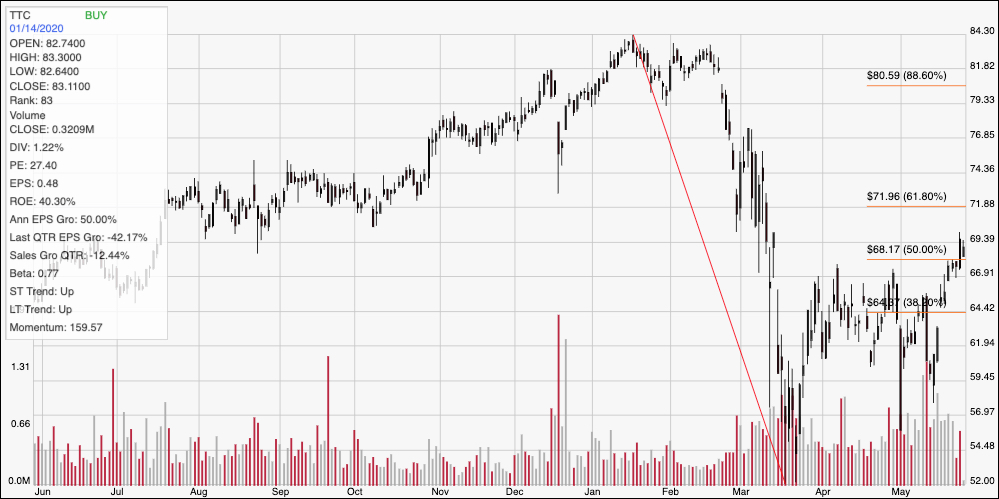
Current Price Action/Trends and Pivots: The diagonal red line on the chart above outlines the stock’s downward trend from a January peak around $84 to its March low at around $52. It also provides the baseline for the Fibonacci retracement lines shown on the right side of the chart. The stock rallied to about $66 in early April before starting to consolidate through the rest of that month around the 38.2% retracement line. The last coupe of weeks saw the stock push strongly above that level, which was $64, and find a peak this week at around $69. Current expected support should be around the 50% retracement line, which is now around $68, with near-term resistance around $72, in line with the 61.8% retracement line. A bounce off of support at $68 could give the stock enough momentum to test $72, with additional upside to about $77 if bullish sentiment continues to hold. A drop below $68 has near-term downside at the 38.2% retracement line around $64, with additional room to fall to about $61 where the bottom of last month’s consolidation range sits.
Near-term Keys: Under current economic conditions, it’s hard to forecast a strong result from TTC’s next earnings report. That means that besides the absence of a useful value proposition, it’s hard to make a strong case for the stock as a useful long-term growth candidate. There could be some opportunities to work with the stock with short-term trading strategies, however; if you’re looking for a way to take advantage of the bullish side of the market with TTC, look for a bounce off of support around $68, with a pivot higher before buying the stock or working with call options. If the stock drops below $68, consider shorting the stock or buying put options with a target price around $64 as a quick-hit target.