Volatility appears to be returning to the markets this week, as concern is increasing about a second wave of COVID-19 infections. Yesterday Fed chair Jerome Powell announced the Fed was planning to keep rates at or near zero through 2022 to support economic recovery following a near-complete shutdown of U.S. business activity in an effort to contain the initial spread of the virus. While the initial thought might be that the prospect for continued low rates should give investors reason to be more bullish – after all, the Fed is committed to holding the mostly accommodative course that it has been following for more than a decade, and that helped to fuel the longest period of economic expansion in recorded U.S. history – but the market seems to be reacting to Mr. Powell’s comments that he and the rest of the board of governors expect the actual recovery to take years, not months. Unemployment numbers forecast by the Fed show they anticipate unemployment will remain near 10% through the end of 2020 and not even begin to approach the historically low, pre-pandemic levels (below 4%) until 2022.
That forecast appears to have thrown cold water on investor hopes that the economy could rebound quickly as businesses reopen; it is also a hard dose of reality that runs counter to the enthusiasm generated by last week’s far more favorable than expected unemployment report. Risks include a second wave of infections, which could be happening right now based on the numbers coming out of states all over the country as they move into less restrictive phases of resuming business and economic activity.
One of the biggest bright spots for investors since the market hit a bear market bottom in March has been the tech sector, where a number of companies in the enterprise computing segment have benefitted from the pandemic-induced shift into remote business operations, including work-at-home arrangements. Those include companies that facilitate remote networking, video conferencing, and cloud storage, to name just a few services.
One of the stocks that has diverged from the positive pattern for the past two months is Hewlett Packard Enterprise Company (HPE). When you think Hewlett Packard, you likely think first about laser printers and laptop computers; but HPE focuses specifically on enterprise-level computing and technology solutions. Think servers, cloud storage, and networking solutions, and you get an idea of where HPE lives. This is an area that, despite its important niche in business operations, has continued to be challenged by increasing competition and slow customer adoption of its service offerings. As a result, while stocks in its industry have moved strongly higher since mid-March, HPE has hovered in a range between about $9 to $10 per share. Last week, the stock appeared ready to break out of that range, but this week has dropped back again. Is that sideways range, which appears to be extending even further into time, and indication of a stock that should eventually break out, with a great value proposition to add fuel to the fire? I’m not sure; the stock has some challenges in its fundamental profile that I think have to be overcome first.
Fundamental and Value Profile
Hewlett Packard Enterprise Company is a provider of technology solutions. The Company’s segments include: Enterprise Group, Software, Financial Services and Corporate Investments. The Enterprise Group segment provides its customers with the technology infrastructure they need to optimize traditional information technology (IT). The Software segment allows its customers to automate IT operations to simplify, accelerate and secure business processes and drives the analytics that turn raw data into actionable knowledge. The Financial Services segment enables flexible IT consumption models, financial architectures and customized investment solutions for its customers. The Corporate Investments segment includes Hewlett Packard Labs and certain business incubation projects, among others. HPE has a current market cap of $12.6 billion.
Earnings and Sales Growth: Over the past year, earnings decreased more than -47.5%, while sales also dropped nearly -16%. In the last quarter, earnings slid -50% lower, while sales dropped by a little over -13.53%. The company’s operating margins are a big red flag, as Net Income has been negative on both a trailing twelve month and last quarter basis; as a percentage of Revenues, Net Income was -0.13% over the last year, with the negative pattern accelerating in the last quarter to -13.66%. This is a strong indication that the company is experiencing significant challenges to its operating profile that challenge its otherwise healthy balance sheet.
Free Cash Flow: HPE’s Free Cash Flow is generally healthy, at $939 million over the last twelve months. This number is markedly lower than the $1.74 billion HPE registered in January of this year for Free Cash Flow, and is a reflection of the negative Net Income pattern I just mentioned. On a Free Cash Flow Yield basis, that translates to 6.83%.
Debt to Equity: HPE has a debt/equity ratio of .71, which is generally a conservative number, but also marks an increase from January of this year when debt/equity was .54. Their balance sheet shows $5.1 billion in cash against $11.5 billion in long-term debt. Both of these numbers increased by more than $2 billion since January of this year, meaning that HPE increased their debt in order to build up cash. I take that as an indication the company is working to increase its liquidity in order to maintain its operations while it works to improve its negative operating profile. That is probably a positive thing in the long term, but in the near term it is also a reflection of the struggles the company is facing. I would prefer to see debt being reduced, while cash increases via improving Net Income and Free Cash Flow, which would be taken as a good signal profitability is becoming stronger.
Dividend: HPE pays a dividend of $.48 per share, which translates to an annual yield of about 4.49% at the stock’s current price. HPE’s dividend payout right now is higher than their earnings per share over the last year, which naturally calls into question how sustainable the dividend is.
Price/Book Ratio: there are a lot of ways to measure how much a stock should be worth; but I like to worth with a combination of Price/Book and Price/Cash Flow analysis. Together, these measurements provide a long-term target at about $13.50 per share. That suggests the stock is carries a useful discount, being undervalued by about 35% right now.
Technical Profile
Here’s a look at the stock’s latest technical chart.
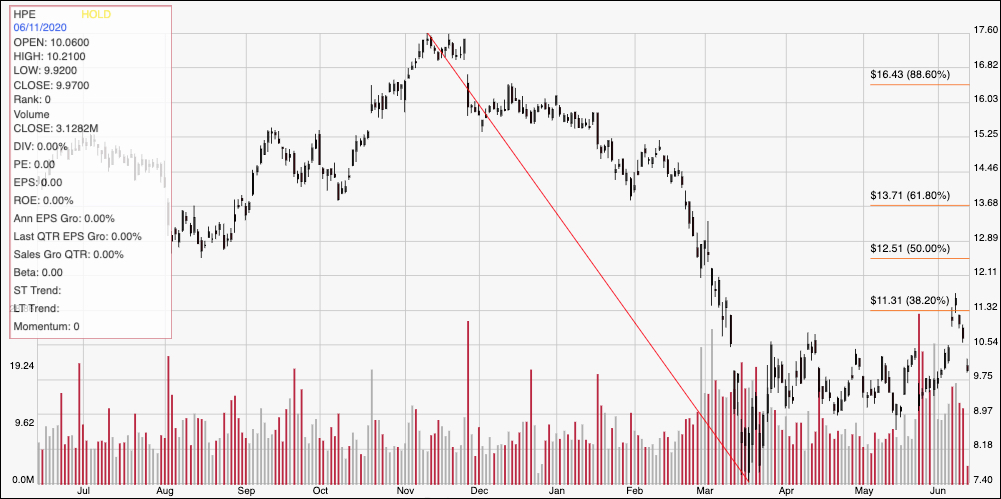
Current Price Action/Trends and Pivots: The chart above covers the last year of price action for HPE. The diagonal red line follows the stock’s downward trend from a peak in November $17.50 to its low in mid-March around $7.40. It also provides the baseline for the Fibonacci retracement levels shown on the right side of the chart. The stock rallied by the beginning of April to a high at around $10.50 before sliding back to the low around $9 that defined the stock’s sideways pattern through the beginning of this month. Last week, the stock broke above $10.50 and appeared set to keep pushing higher, as it hit the 38.2% retracement line at around $11.30 before dropping back this week. The stock dropped back below the $10.50 line, meaning that is resistance once again, with support expected to be around $9. The stock would need to drive above the 38.2% retracement line, to about $11.50 to provide a useful sign that the stock is building bullish momentum, with upside from that point to about $13 per share based on pivot lows in that area last summer. A drop below $9 would act as a strong signal that the stock is picking up bearish momentum, and should test its multi-year low around $7.50.
Near-term Keys: Unfortunately, HPE is a stock with a value proposition that I think is misleading enough to call the stock a value trap. The stock has some big holes in a couple of fundamental metrics – Net Income and Free Cash Flow – that I consider critical to an accurate representation of corporate profitability. I would wait to see improvement in these metrics before taking any actual value proposition the stock may offer seriously. That also means that the best probabilities of success lie in short-term trades. If the stock can pick up new bullish momentum, and drive to about $11.50, there could a good signal to buy the stock or work with call options, with an eye on $13 as a quick-hit profit target. A drop below $9, on the other hand could be a signal to consider shorting the stock or buying put options, using the stock’s low around $7.50 as a profit target on a bearish trade.