If you pay attention to market news media, you’ll see a lot of different opinions about current events, what they mean for the economy, and therefore the markets. That’s true no matter whether the economy is growing or not, or whether the stock market is going up or down. I’ve learned to take the majority of the information with a large grain of salt – meaning that most of it isn’t worth taking too seriously. Every so often, though, you’ll find something thought-provoking, or even useful to help inform and shape your own view of how to keep your money working for you.
Over the last couple of days, one commentator I hear from quite often has been framing the market’s reaction to COVID-19 in pretty practical terms. Using the months since the virus hit American shores, he categorized February and March, not too surprisingly as panic and selloff, April and May as recovery anticipation, and June as recovery re-evaluation. The description follows the sharply V-shaped pattern of the broad market’s price pattern, including the sell that began last week and what looks like is shaping up to be a stabilization and consolidation phase this week.
What does that analysis mean for practical investing decisions? First, I think that it means not to draw too many conclusions about the market and its future direction based on last week’s sharp drop, or on this week. Stabilization and consolidation phases are pretty normal at any price extreme; they usually just mean that investors are stepping back to try to figure out what to do next. If the market has been rallying sharply prior to the consolidation, it means that some investors will start taking profits off of the table, but not so much that the market completely reverses its longer trend. If the market has been dropping sharply and begins to stabilize, it means that investors are starting to buy again, at least on a selective basis, which offers support to prices, but not so much that demand starts forcing prices into a new upward rally.
That also means that as you’re looking for new investing opportunities, use consolidation periods as opportunities to look critically at what has been driving the stock’s price direction. If the stock has been rallying, and the company’s fundamentals are solid, you can get that the market is starting to price that strength into the stock’s price. If valuations are still reasonable, you can usually still make a pretty strong case to suggest the stock could keep going for the foreseeable future. If the stock has been rallying, but the company’s fundamentals are less than stellar, then you may be looking at a stock that is simply benefitting from broad market or sector rotation – it’s probably a beneficiary of the mantra, “a rising tide lifts all ships.”
With that in mind, I give you today’s highlight. Nucor Corp (NUE) is the largest steelmaker in the United States, which means that it fills an important spot not only in the steel industry, but the Materials sector. I like to use the Materials sector as a barometer for the broad economy, as the sector provides so many of the component and basic goods that companies in other sectors use for the finished goods and products. Like the rest of the market, COVID-19 fears, including broad-based business restrictions and shutdowns prompted investors to push the stock more than -50% lower, to around $27.50 in mid-March. Since then, however the stock has rebounded strongly, increasing by more than 50% from that low point. More than some of that rally is almost certainly tied to the “recovery anticipation” and enthusiasm I mentioned earlier, as investors are hoping that whatever impact the initial phase of coronavirus has on operations will be temporary at best. Does that mean the stock still has room to revisit its 2019 highs at nearly $60? Let’s dive in and find out.
Fundamental and Value Profile
Nucor Corporation (Nucor) manufactures steel and steel products. The Company produces direct reduced iron (DRI) for use in its steel mills. It operates in three segments: steel mills, steel products and raw materials. The steel mills segment produces and distributes sheet steel (hot-rolled, cold-rolled and galvanized), plate steel, structural steel (wide-flange beams, beam blanks, H-piling and sheet piling) and bar steel (blooms, billets, concrete reinforcing bar, merchant bar, wire rod and special bar quality). The steel products segment produces steel joists and joist girders, steel deck, fabricated concrete reinforcing steel and cold finished steel. The raw materials produces DRI; brokers ferrous and nonferrous metals, pig iron, HBI and DRI; supplies ferro-alloys, and processes ferrous and nonferrous scrap metal. It also processes ferrous and nonferrous metals and brokers ferrous and nonferrous metals, pig iron, hot briquetted iron (HBI) and DRI. NUE has a current market cap of $13.3 billion.
Earnings and Sales Growth: Over the last twelve months, earnings declined by -36%, while sales also declined by almost -7.75%. In the last quarter, earnings improved dramatically, by 90%, while revenues rose more than 9.5%. That is a positive pattern that, unfortunately doesn’t extend to NUE’s operating profile, which has been deteriorating since before the pandemic began. Over the last twelve months, Net Income was 3.57% of Revenues (versus 7.62% for the trailing twelve-month period at the beginning of 2020) and narrowed even more to 0.36% in the last quarter (versus 5% at the beginning of the year).
Free Cash Flow: NUE’s Free Cash Flow is generally healthy, but has also narrowed in the wake of the pandemic. At the beginning of the year, this number was $1.3 billion, but in the last quarter slid backwards to $793.8 million. This is a number that has declined from a little more than $1.85 billion in March of 2019, and translates to an adequate Free Cash Flow Yield of 6.29%.
Debt to Equity: NUE has a debt/equity ratio of .40, which is a conservative number. Their balance sheet shows $1.3 billion in cash and liquid assets (down from $1.9 billion at the beginning of the year) against $4.2 billion of long-term debt. Their narrowing margin and free cash flow profile means that as operating profits have narrowed, the company has been forced to use its available cash to service its debt. The longer this condition persists, the more likely it becomes that liquidity could become a problem.
Dividend: NUE pays an annual dividend of $1.61 per share, which translates to a useful dividend yield of about 3.61%. NUE is among a select group of stocks – called dividend kings – with a long history of stable, and increasing dividend payments.
Price/Book Ratio: there are a lot of ways to measure how much a stock should be worth; but I like to work with a combination of Price/Book and Price/Cash Flow analysis. Together, these measurements provide a long-term, fair value target around $58.68 per share. That means that even with the stock’s current upward trend and rise from its March low, the stock is nicely undervalued, with about 33% upside from its current price.
Technical Profile
Here’s a look at the stock’s latest technical chart.
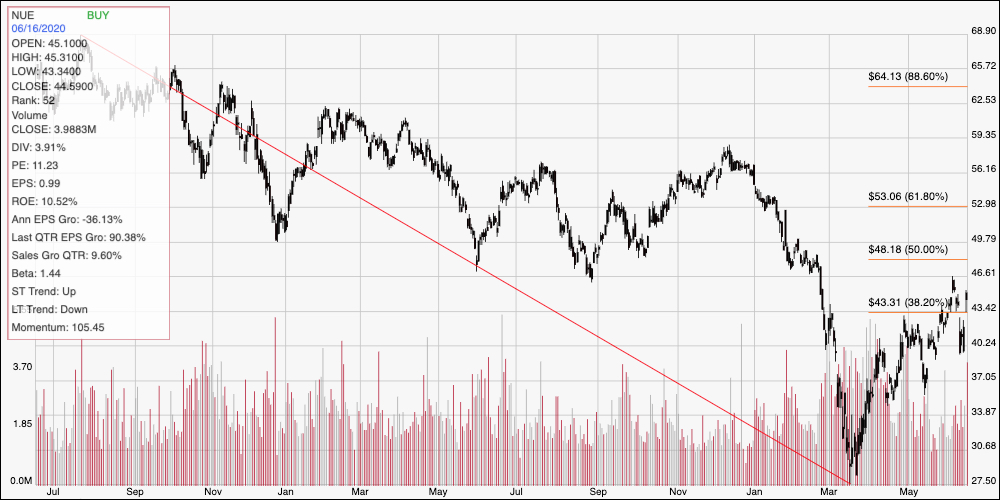
Current Price Action/Trends and Pivots: This chart displays the last two years of stock performance for NUE. It also provides the baseline for the Fibonacci retracement lines shown on the right side of the chart. It’s also useful for framing the stock’s current, intermediate-term upward trend against a broader context. The stock temporarily pushed above the 38.2% retracement line resistance to a peak at around $46 before dropping back sharply last week. The stock is now just a little below that peak; I put resistance somewhere between $46 and $48 where the 50% retracement line rests. A push above $48 should give the stock room to rally to at least $53 in the short-term, with additional upside to about $58 – $59 if bullish momentum remains strong. Support is sitting back around $43 where the 38.2% retracement line rests; a drop below that point could see the stock fall to somewhere between $37 and $39 per share.
Near-term Keys: NUE’s value proposition is interesting, and could even be considered tempting; I think the company’s deteriorating Net Income and Free Cash Flow, along with dwindling liquidity are big enough concerns, however that I would prefer to see these measurements show signs of stabilization before taking a long-term, value-based opportunity seriously. There could be some interesting opportunities to work with short-term trading strategies depending on the stock’s price action in the days and weeks ahead. A push above $48 could be a good signal to buy the stock or work with call options, using $53 as a good profit target level on a bullish trade. If the stock drops below $43, consider shorting the stock or buying put options, with $39 acting as a useful bearish profit target, and $37 providing a little extra profit if downward momentum remains strong.