No matter what current market conditions are at any given time, the point of value-oriented investing is to find stocks that offer attractive long-term upside. For my approach, that means using a combination of valuation, fundamental strength, and technical analysis to filter through the thousands of stocks that are available.
With investors seemingly anxious to find reasons to be optimistic, even as uncertainty in the last week and a half has increased, it’s tempting to gravitate to the stocks that have been the “star performers” of the last three months. In many ways, that means working with stocks that have proven to be well-positioned to a global shift in the way daily work gets done. Remote networking, collaboration and connectivity, for example are at a real premium right now as major portions of the corporate workforce have shifted to long-term, and in some cases, permanent work-from-from arrangements, which means that the companies – by and large, operating in the Networking and Services and Software industries of the Technology sector – that offer solutions and services that make that shift possible have been at the front of the pack.
My approach to value analysis puts a big emphasis on stocks that are currently sitting at or near historical lows. In a bull market, these are stocks that have diverged from the rest of the market, and so most investors tend to shy away from these kinds of stocks. That’s why value investing can sometimes be a bit of a contrarian approach, especially at the long end of a bull market. Given the continuing state of pandemic conditions, I’m hesitant to call for a new bull market after hitting bear market lows. If you think about the bullish rally in tech stocks that fueled the broader market’s rally into June, a contrarian approach is to look at the companies on the opposite end of the spectrum – those who previously relied heavily on traditional daily working operations to fuel their own business operations and generate revenues.
International Paper Company (IP) is a good example of the kind of company that has taken a sizable hit in the last quarter as traditional business activity came to a grinding halt. While remote work has enabled a lot of companies to keep going, and to keep their employees working and productive, it has also meant that the demand for goods like basic office supplies – think printer paper, for example – dropped to a mere trickle. IP is one of the biggest companies in the Containers & Packaging industry of the Materials sector, and their conservative management approach enabled them to build a healthy balance sheet that has taken the initial force of that downturn pretty well. As the market recovered from mid-March to last week, the stock rebounded strongly as well, hitting a short-term high a little below $40 per share. It’s down about -10% from that high since then, but is still up 34% since March. The value proposition still looks very attractive; but are the fundamentals strong enough to justify buying the stock right now?
Fundamental and Value Profile
International Paper Company is a paper and packaging company with primary markets and manufacturing operations in North America, Europe, Latin America, Russia, Asia, Africa and the Middle East. The Company operates through it four segments: Industrial Packaging, Global Cellulose Fibers, Printing Papers and Consumer Packaging. The Company is a manufacturer of containerboard in the United States. Its products include linerboard, medium, whitetop, recycled linerboard, recycled medium and saturating kraft. The Company’s cellulose fibers product portfolio includes fluff, market and specialty pulps. The Company is a producer of printing and writing papers. The products in Printing Papers segment include uncoated papers. IP has a current market cap of about $13.9 billion.
Earnings and Sales Growth: Over the last twelve months, earnings declined -48.6%, while revenues dropped by about -5.2%. In the last quarter, earnings were -47.7% lower, while sales dropped by -2.66%. The company’s margin profile has deteriorated significantly this year; Net Income as a percentage of Revenues was a narrow 2.99% over the last twelve months and dropped to -2.63% in the last quarter.
Free Cash Flow: IP’s free cash flow is strong at $2.27 billion. This number did drop somewhat from the end of 2019, when it was $2.33 billion; however it also translates to a Free Cash Flow Yield of 16.44%, which is attractive.
Debt to Equity: IP has a debt/equity ratio of 1.4. This is a high number that is a strong indication of the company’s highly leveraged status, but is also inline with industry averages. IP currently has a little over $1.2 billion in cash and liquid assets against about $9.8 billion in long-term debt. Given the company’s negative Net Income over the last quarter, there is concern about debt service; the company’s liquidity is sufficient for the time being to make debt payments, but the longer they continue to pay out more money than they are bringing in, the harder that will become. This remains a big red flag that need to show improvement in the quarters ahead.
Dividend: IP’s annual divided is $2.05 per share; that translates to a very attractive yield of 5.83% at the stock’s current price. The company appears to be committed to maintaining the dividend for the time being, but given the operating challenges they are facing, and the fact management has suspended their share buyback program, the stability of their dividend at its current level should be questioned.
Price/Book Ratio: there are a lot of ways to measure how much a stock should be worth; but I like to work with a combination of Price/Book and Price/Cash Flow analysis. Together, these measurements provide a long-term, fair value target around $59 per share. That means that even with the stock’s current upward trend and rise from its March low, the stock is significantly undervalued, with about 67% upside from its current price.
Technical Profile
Here’s a look at the stock’s latest technical chart.
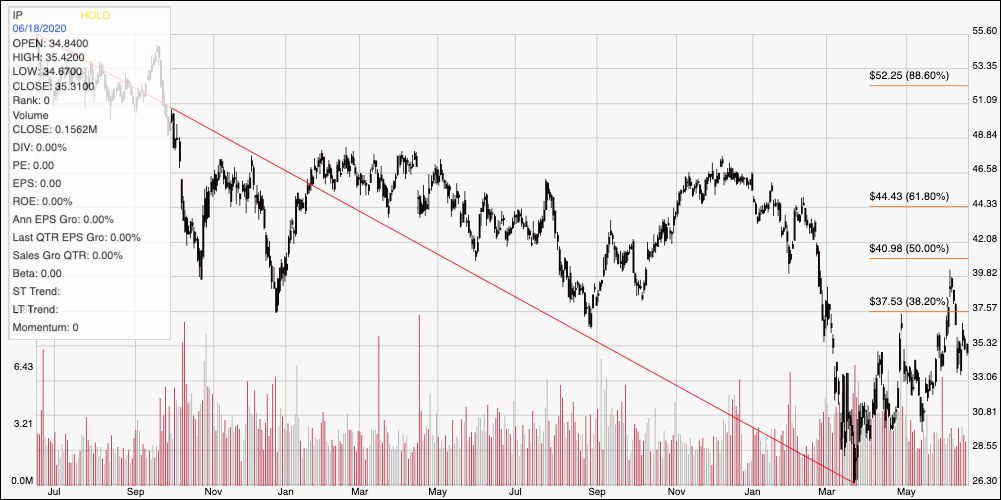
Current Price Action/Trends and Pivots: The red line on the chart above outlines the stock’s downward trend from July of 2018 to its March low at around $26; it also informs the Fibonacci retracement levels on the right side of the chart. From that low point, the stock pushed almost to the 50% retracement line, to a high a little below $40 before dropping back in the last week to find new support at around $35 per share. It is currently about $2 below the 38.2% Fibonacci retracement line, which is around $37.50, and marks the stock’s closest resistance. If it can push above that level, look for the stock to test its recent pivot high at $40 before the stability of its current upward trend can be confirmed. A drop below $35 could see the stock fall to as low as $30 before finding new support again, based on pivot lows seen in April and May.
Near-term Keys: The stock’s current bullish momentum lends a strong idea to looking for a bullish short-term trade; a break above $37.50 could be taken as a good signal to buy the stock or to work with call options with an eye on $40 as a short-term profit target, and $44 providing a nice secondary target if momentum pushes the stock past its last pivot high. A drop below $35, on the other hand would act as a good signal to think about shorting the stock or working with put options, using $30 as a nice bearish trade target. The company’s value proposition looks very tempting; however the weakness shown by the company’s deteriorating Net Income pattern is a major concern. I would prefer to wait to see signs this metric has begun to stabilize before taking a long-term investment in IP seriously.