Over the last several years, one of the biggest benchmarks the Fed has used to evaluate the need to raise, lower or maintain their interest rate policy has been the employment rate. Every month, the market seems to hold its breath as a new set of unemployment and salary data is made available and everybody gets to wonder what the information means for the current economic climate and, therefore, for interest rates. COVID-19 news has dominated the news media since March, and with infections spiking throughout the United States and forcing people to start giving serious thought to the need to re-impose social restrictions, you can bet it will continue to do so. That’s bad news for unemployment numbers, which had plunged to their worst levels in decades because of the initial surge of the virus, and has remained high, but has also been showing signs of gradual improvement.
ManpowerGroup Inc. (MAN) is one of the largest providers of workforce solutions and services, with operations that span the globe. So far, the most dramatically affected industries have been those that rely the most on face-to-face interactions, such as restaurants, theaters, and so on. On the other hand, the pandemic has also forced much of corporate America to shift to a work-at-home model, which has managed to keep employment numbers for highly skilled technical and professional occupations relatively healthy. That supports the idea that demand for staffing services such as those provided by MAN could also continue to be healthy.
That certainly doesn’t mean there aren’t risks. So far, governors across the U.S. have reiterated their determination to manage through the pandemic rather instituting a new wave of closures. That may be possible, but if health care resources – for example, hospital beds and intensive care treatment options for infected individuals, which in some areas of the country are showing signs of strain, become overwhelmed, it may not matter how much people want the economy to remain open.
In the most generalized sense, economic downturns tend to be strongly negative for a company like MAN, and this is a stock that has reflected that reality, both in its stock price and in the company’s operating characteristics as of the latest earnings report. The stock fell back more than -50% from its January high price around $101 to a pandemic, bear market low around $49.50 in March, but then rallied to an intermediate-term high around $80 at the beginning of this month as hope increased that the worst economic fallout was behind us. Over the last couple of weeks, though as it has become increasingly clear that easing social and economic restrictions has also coincided with an increase in new infections, the stock has slid back to its current price around $66. That’s still quite a bit better than its March low, and significantly below its highs, both from earlier this month and its 52-week high in January. Does that mean the stock might also be a good value to think about?
Fundamental and Value Profile
ManpowerGroup Inc. is a provider of workforce solutions and services. The Company’s segments include Americas, Southern Europe, Northern Europe, Asia Pacific Middle East (APME), Right Management and Corporate. The Company’s Americas segment includes operations in the United States and Other Americas. Its Southern Europe segment includes operations in France, Italy and Other Southern Europe. Its Northern Europe segment includes operations in the United Kingdom, the Nordics, Germany and the Netherlands. The Company’s APME operations provide a range of workforce solutions and services offered through Manpower, Experis and ManpowerGroup Solutions, including permanent, temporary and contract recruitment, assessment and selection, training and outsourcing. The Company’s Right Management segment provides talent and career management workforce solutions. The Company provides services under its Experis brand, particularly in the areas of information technology (IT), engineering and finance. MAN’s current market cap is $3.9 billion.
Earnings and Sales Growth: Over the last twelve months, earnings declined by almost -49% while revenues declined by about -8.5%. In the last quarter, earnings dropped by nearly -67%, while sales were down -11%. MAN operates with a very narrow margin profile that has narrowed during the pandemic to nearly zero; over the last twelve months, Net Income was 2.03% of Revenues, and was just 0.04% in the last quarter. It can be said that the fact this number didn’t turn negative in the last quarter is a positive; but I think it really means that this measurement bears watching in the quarters ahead to see whether it reverses, stabilizes, or continues to deteriorate.
Free Cash Flow: MAN’s free cash flow is healthy, at about $838 million. This is a number that has improved significantly from a year ago, when Free Cash Flow was a more conservative, but growing $522.7 million (well above the year prior to that). This is a good sign the company’s overall profitability continues to improve and also provides an interesting counterpoint to the negative Net Income picture I just described. It also translates to a very healthy Free Cash Flow yield of 19.62%.
Debt to Equity: MAN has a debt/equity ratio of .50. This is a conservative number that is manageable despite its increase over the last year or so from .17. The company’s balance sheet indicates that despite its razor-thin margin profile, it is sufficient to service its conservative level of debt, with healthy liquidity from about $1.02 billion in cash (a number that held steady from pre-pandemic levels) and liquid assets to provide additional flexibility against $1.3 billion in long-term debt.
Dividend: MAN pays an annual dividend of $2.18 per share, which translates to a yield of about 3.25% at the stock’s current price. This is also nicely above the $2.02 per share it paid a year ago.
Price/Book Ratio: there are a lot of ways to measure how much a stock should be worth; but I like to work with a combination of Price/Book and Price/Cash Flow analysis. Together, these measurements provide a long-term, fair value target at about $112 per share. That means the stock is trading at a significant discount, with about 69% upside from the stock’s current price.
Technical Profile
Here’s a look at the stock’s latest technical chart.
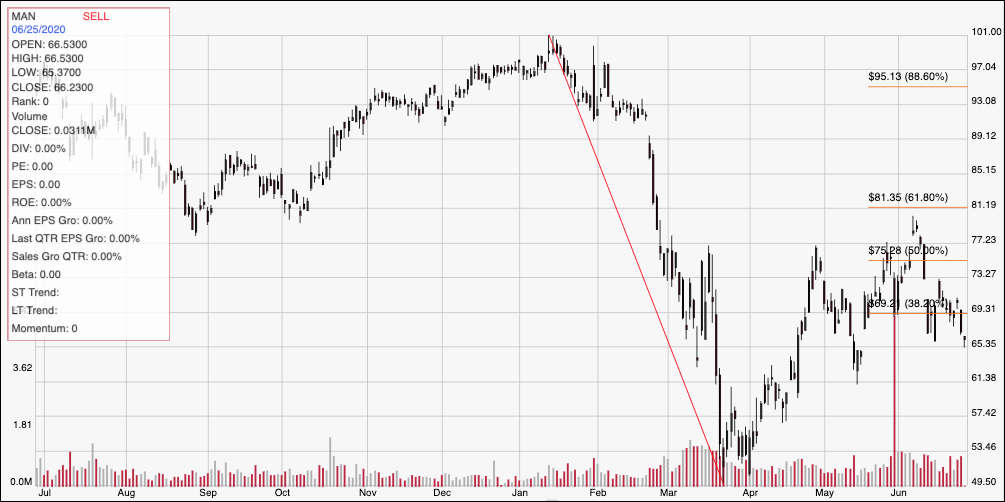
Current Price Action/Trends and Pivots: The red diagonal line measures the length of the stock’s downward trend from January to its March low; it also informs the Fibonacci trend retracement lines shown on the right side of the chart. Its peak earlier this month tested the 61.8% retracement line at around $80, but this week the stock has fallen below the 38.2% retracement line, marking immediate resistance at around $69 per share. A push back above that line should give the stock room to test its near-term high between $75 and $77, which is also around the 50% retracement line. Immediate support is right around the stock’s current price around $66; a further drop below that point could see the stock fall to previous pivots around $61 before finding new support, and additional downside in the mid-$50 range if bearish momentum accelerates.
Near-term Keys: If you’re looking for a short-term bullish trade, the best signal would come from a push above $69; the stock could have good upside to about $75 in that case where the 50% Fibonacci retracement line rests. If the stock drops below $66, take it as a strong signal to consider shorting the stock or to work with put options, with an eye on an exit target in the $61 range. The value proposition is compelling at the stock’s current price; however the current state of momentum, and the broader economic uncertainties that are putting the market on edge right now make me hesitate to say this is a great time to buy the stock as a long-term value play. I think it would be wise to wait to see signs of stabilization in Net Income, or possibly even improvement in that critical fundamental component first.