Being a contrarian investor can mean a few different things. To some, contrarian investing is correlated with value investing, and I think that makes sense in a lot of ways. For one thing, being a contrarian means recognizing that all price trends – up or down – are finite in length and duration. That means that eventually, upward trends reverse down, and downward trends inevitably reverse up. That understanding dovetails nicely with technical trend analysis, where traders try to identify stages where trend reversals become more likely, which can then provide useful signals to reverse the direction of their trading. Looking for those times, and those signals is something that I have found to be a useful supplement to my value analysis, and to generally increase the probability that the stocks I work with not only offer good price discounts, but also represent useful opportunities to profit from a reversal to a new upward trend.
Another reason value analysis and the contrarian mindset often complement each other is because while most investors shy away from stocks that are dropping, value investors and contrarians alike start to take them more seriously. That contrarian mindset also tends to shade an investor’s perspective when a stock is going up; the longer an upward trend lasts, the more a contrarian begins to doubt the trend will be able to last. That is an attitude that often flies in the face of the herd mentality that often accompanies big upward moves in a stock’s price – especially if broader economic or societal conditions coincide with that rally.
The J.M. Smucker Company (SJM) is an interesting example of what I mean. If you’ve followed this space for very long, you’ve seen me write quite a bit about my opinion that stocks in the Consumer Staples sector, and Food Products even more specifically, are a good place to be putting your money. A few months ago, that was a strongly contrarian claim to make, because the sector and that industry were pretty strongly out of favor with the movement of the rest of the market. SJM’s price movement at that time mirrored the industry, dropping from a high at around $128.50 to a low at the beginning of the year at around $103 per share. As COVID-19 fears increased, and social distancing and stay-at-home measures were put in place across North America to try to limit the virus’ spread, Food Products stocks like SJM started to see a big jump in volatility as the swings in price became more and more dramatic. After hitting a new low in mid-March at around $95, SJM started a big, new rally, hitting a peak around $124 in mid-April – a rebound of more than 30% in about a month. Since then, the stock has dropped back, settling in the last week or so near to its current price a little below $106. The drop over of the last three months diverges from the pattern of a lot of other stocks in the Food Products industry, where prices have generally held steady over the same period.
The stock’s drop from the April high also flies in the face of signs the company’s fundamentals are improving; Free Cash Flow has improved, and so has liquidity in the form of cash and liquid assets. The tendency of American consumers to stockpile as much as possible in the early stages of the pandemic were a big early reason that sales for the company have been increasing; but there are also indications that demand for prepackaged foods that are available at good value prices remains high, since economic uncertainty is also not likely to abate through most of the year. That could mean that most of the stock’s decline since April is just a natural reaction to the fast and furious pace of its rally; it could also mean that the stock’s value proposition is attractive enough to make SJM a stock consider using as part of a useful, value-oriented portfolio.
Fundamental and Value Profile
The J. M. Smucker Company is a manufacturer and marketer of branded food and beverage products and pet food and pet snacks in North America. The Company’s segments include U.S. Retail Coffee, U.S. Retail Consumer Foods, U.S. Retail Pet Foods, and International and Foodservice. The Company’s U.S. retail market segments consist of the sale of branded food products to consumers through retail outlets in North America. In the U.S. retail market segments, the Company’s products are sold to food retailers, food wholesalers, drug stores, club stores, mass merchandisers, discount and dollar stores, military commissaries, natural foods stores and distributors, and pet specialty stores. In International and Foodservice, the Company’s products are distributed domestically and in foreign countries through retail channels and foodservice distributors and operators, such as restaurants, lodging, schools and universities, healthcare operators.SJM’s current market cap is $12 billion.
Earnings and Sales Growth: Over the last twelve months, earnings improved 23.56%, with sales also increasing nearly 10%. In the last quarter, earnings rose 9.36%, while sales grew by a little over 6%. SJM’s margin profile is healthy, and getting stronger; over the last twelve months, Net Income was 9.99% of Revenues, and increased in the last quarter to about 10.82%. These are solid signs the company is operating more efficiently right now than it was just a few months ago.
Free Cash Flow: SJM’s free cash flow is healthy, at around $988 million for the trailing twelve month period; that translates to a Free Cash Flow yield of about 8.19%. SJM’s free cash flow has improved consistently from late 2019, when the number was just about $723 million.
Debt to Equity: SJM has a debt/equity ratio of .67, a relatively low number that indicates the company operates with a conservative philosophy about leverage. A big portion of their long-term debt, which was about $5.5 billion in the last quarter comes from the acquisition of pet food company Ainsworth in May of 2018 for $1.7 billion. Cash and liquid assets are limited, at only $391.1 million, but this is an improvement from the latter part of 2019 when cash was only around $48 million. While their balance sheet for now indicates their operating margin is more than adequate to service their debt, and liquidity is growing, it is still a concern and could be a challenge in quarters to come. The increase is a good sign, but cash needs to keep increasing, with long-term debt coming down, to mark a significant change in SJM’s balance sheet strength.
Dividend: SJM pays an annual dividend of $3.52 per share, which translates to a yield of 3.32% at the stock’s current price.
Price/Book Ratio: there are a lot of ways to measure how much a stock should be worth; but I like to work with a combination of Price/Book and Price/Cash Flow analysis. Together, these measurements provide a long-term, fair value target around $124 per share. That means the stock is undervalued with about 17% upside from its current price.
Technical Profile
Here’s a look at the stock’s latest technical chart.
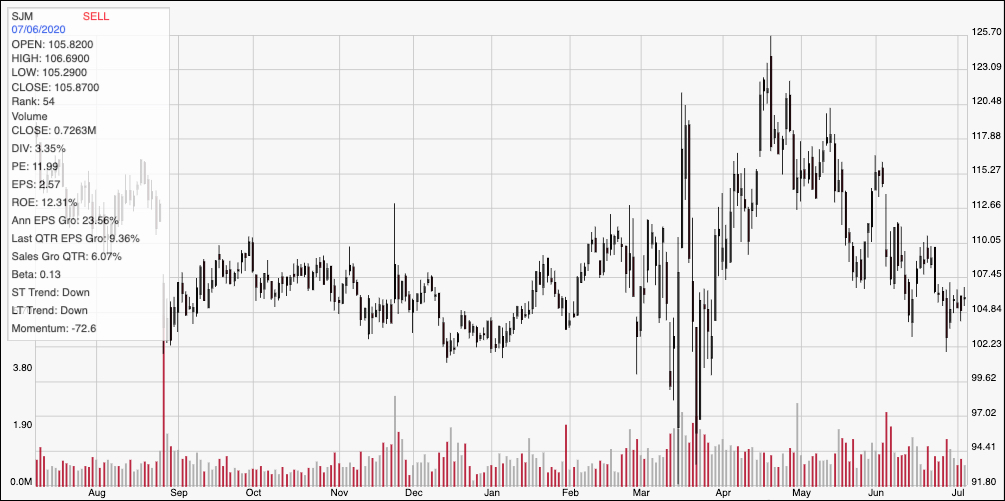
Current Price Action/Trends and Pivots: The chart above displays the stock’s price activity over the last year. The stock’s decline from its April high traces a clear downward trend, with the stock pivoting off of a new swing low last week at around $102. It also appears to be coming up against immediate support at around $107 per share. A push above $107 should give it room to test next resistance at $110, but would need to break above $110 to reverse the stock’s current downward trend. A drop below $102 could see the stock test its March low at around $95.
Near-term Keys: SJM’s fundamentals are generally solid, and improving, even as liquidity remains a concern and continues to bear watching. The value proposition at the stock’s current price is much better than it was in April, and could be a good reason to start watching the stock more closely. If bullish momentum continues and pushes the stock above $110, you could use that as a signal to buy the stock or work with call options, using $115 to $117 as a good initial exit target. If momentum forces the stock to drop below $102, you could use that as a signal to consider shorting the stock or working with put options, with $95 acting as the exit target on a bearish trade.