There is a pretty significant difference in the way different investors perceive a stock in a long-term downward trend. For growth oriented-investors, the longer the downward trend, the less attractive the stock is, simply because the expectation is that the longer, bearish trend will outlast any near-term, bullish sentiment or momentum the stock may see. On the other hand, a stock in a downward trend, even a long-term one, is something that piques the interest of value-oriented investors – especially if, like me, they also tend to operate with a bit of a contrarian view of the world.
The challenge for value investors is that sometimes, a stock in a long downward trend has a very good reason for being where it is – sometimes, a cheap stock is just a cheap stock. Efficient market theory holds that in the broadest sense, the market is very good at pricing a company’s underlying fundamental weakness or strength into a stock’s price. That is often very much the case, which is why it is important to always be careful about considering a stock in a long-term downward trend for any kind of bullish position. It’s why I concentrate not only on a stock’s value proposition, but also make sure to run through a detailed view of the company’s business.
The Mosaic Company (MOS) is a company in the Materials sector I’ve followed for some time that has underperformed the market, with a downward trend that began in late 2018 from a high at around $36. This is a fertilizer producer that tends to be very sensitive to the impact of weather on commodity prices, and extended periods of inclement weather in 2019 put a lot of pressure on the company in the form of increased materials costs from limited supply. The downward trend accelerated even more with the beginning of 2020 and the coronavirus pandemic, pushing the stock down to a bear market low around $6 in March. The stock has recovered to around $16 as of this writing, with a healthy piece of momentum building in the last week after the company’s last earnings report. Has the company finally turned a corner that will finally allow its fundamentals to line up with its value proposition, or is this still just another “cheap stock?” Let’s find out.
Fundamental and Value Profile
The Mosaic Company is a producer and marketer of concentrated phosphate and potash crop nutrients. The Company operates through three segments: Phosphates, Potash and International Distribution. The Company is a supplier of phosphate- and potash-based crop nutrients and animal feed ingredients. The Phosphates segment owns and operates mines and production facilities in Florida, which produce concentrated phosphate crop nutrients and phosphate-based animal feed ingredients, and processing plants in Louisiana, which produce concentrated phosphate crop nutrients. The Potash segment mines and processes potash in Canada and the United States, and sells potash in North America and internationally. The International Distribution segment markets phosphate-, potash- and nitrogen-based crop nutrients and animal feed ingredients, and provides other ancillary services to wholesalers, cooperatives, independent retailers and farmers in South America and the Asia-Pacific regions. MOS has a current market cap of about $6.2 billion.
Earnings and Sales Growth: Over the last twelve months, earnings declined -8.33%, while revenues declined by a little over -6%. In the last quarter, earnings improved dramatically, by 283.33%, while sales improved almost 13.7%. The company’s margin profile has been negative, but is starting to show signs of recovery; Net Income as a percentage of Revenues increased from 12.92% over the last twelve months to 2.32% in the last quarter.
Free Cash Flow: Like Net Income MOS’s free cash flow over the last twelve months is $638.2 million. That’s a big reversal from late 2019, which this number was -$249 million. It still has a long way to go to reach the company’s previous Free Cash Flow peak, which was a little over $1 billion in the 3rd quarter of 2018, but the reversal, along with the positive turn in Net Income, is a positive indication the company is benefitting from increasing fertilizer demand, not only in the U.S., but also in Brazil and China.
Debt to Equity: MOS has a debt/equity ratio of .52. This is a conservative number. MOS currently has a little over $1 billion in cash and liquid assets against about $4.5 billion in long-term debt. The company’s balance sheet indicates their operating profits are adequate to service the debt they have, with improving liquidity (cash was around $640 million at the end of 2019) providing additional flexibility.
Dividend: MOS’s annual divided is minimal, at only $.20 per share; that translates to a yield of just 1.24% at the stock’s current price.
Price/Book Ratio: there are a lot of ways to measure how much a stock should be worth; but I like to work with a combination of Price/Book and Price/Cash Flow analysis. Together, these measurements provide a long-term, fair value target around $22 per share. That means that MOS is nicely undervalued, with about 37% upside from its current price.
Technical Profile
Here’s a look at the stock’s latest technical chart.
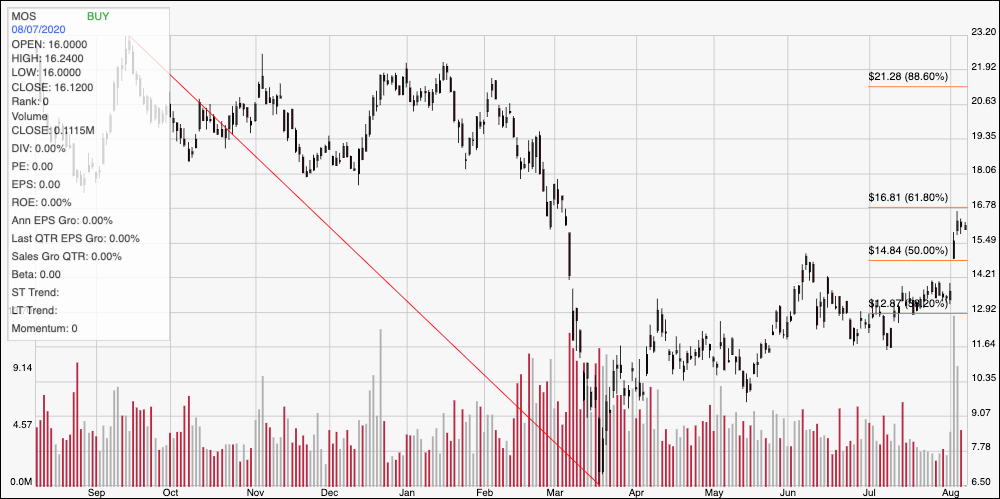
Current Price Action/Trends and Pivots: The red line on the chart above outlines the stock’s downward trend from September of 2019 to March of this year; it also informs the Fibonacci retracement levels on the right side of the chart. The stock’s rebound from its bear market low saw it hover around the 38.2% retracement line at about $13 until July, when the stock started to expand its trading range ahead of its earnings report at the end of the month. From that point, bullish momentum has really increased, with the stock breaking above the 50% retracement line and now just a little below the 61.8% retracement line a little below $17. The stock also has resistance from previous pivots at around $18, so a break above $18 would be needed to really give the stock bullish momentum to push up to around $22 where the stock’s pre-pandemic highs lie. Current support is back at the 50% retracement line, around $15; a drop below that point should see the stock drop to at least $13 or a little below that where the 38.2% retracement line sits.
Near-term Keys: MOS has seen a couple of important fundamental measurements reverse in the last quarter, and that is something that makes their long-term value proposition look a lot more attractive. Global economic trends also appear to be moving in the company’s favor, meaning that the long-term prospects look better than they have in some time. If you prefer to work with short-term trading strategies, and you don’t mind being aggressive, a break above $17 could be a good signal to consider buying the stock or working with call options. A push above $18 would be a better signal, however, with upside from that point to about $21 or $22. A drop below $15 should be taken as a signal to think about shorting the stock or buying put options, using the 38.2% retracement level at around $13 as a near-term profit target, and $11.50 below that if bearish momentum continues.