One of the reasons I think the economy, and the financial markets are such a fascinating thing to watch is because of the way companies in different aspects of business relate to each other. It’s one thing to look at a retail store, for example and think about basic fundamental elements like sales, earnings, and what non-financial metrics like foot traffic mean for a company’s bottom-line results. It’s quite another to add to the overall picture by thinking about the other companies that store may rely on for other important aspects of its business – credit card processing, wholesale distribution, advertising, and more. While those businesses are related by nature of the supportive relationship they offer, they often exist in entirely different industries or sectors. All together, it creates an interweaving tapestry of cooperative dependence that becomes really interesting to think about.
Understanding how some of those relationships work for a company you may have been following for a while can also help identify new opportunities to think about. Over the last couple of years, companies in the Pharmacy industry have become more and more interesting to me, and a more consistent part of my investing method. This week I’ve started to add some of the companies that support the largest players in the industry, and it’s been useful way to increase my understanding of the Pharmacy stocks I’ve followed and used.
In the pharmaceutical distribution space, there are three primary companies, each of whom work under joint venture (JV) agreements with the three largest retail pharmacy chains in the United States. Cardinal Health Inc. (CAH) operates a JV with CVS Corp (CVS) to improve bargaining power versus generic drug manufacturers. For defensive purposes, I like to keep track of the major pharmacy companies, and I think it makes sense to do the same for the companies that they use to stock their shelves.
Like a lot of stocks in the market, CAH followed the broad market’s rally from a bear market low in March to rally near to its pre-pandemic highs in early June, and then again at the beginning of this month. From that most recent high at almost $59 per share, however the stock has dropped back almost -15% following its most recent earnings announcement. The drop is interesting, because that report provided some interesting indications that the company’s overall fundamental profile, which as with so many other stocks so far this year has been challenged by pandemic-induced slowdowns, has started to improve in some constructive ways. Does the drop back over the last few weeks create an interesting value-based opportunity for CAH? Let’s find out.
Fundamental and Value Profile
Cardinal Health, Inc. is a healthcare services and products company. The Company operates through two segments: Pharmaceutical and Medical. The Pharmaceutical segment distributes branded and generic pharmaceutical, specialty pharmaceutical, over-the-counter healthcare and consumer products. This segment also operates nuclear pharmacies and cyclotron facilities; provides pharmacy management services to hospitals, as well as medication therapy management and patient outcomes services to hospitals, other healthcare providers and payers, and provides services to healthcare companies. The Medical segment distributes a range of medical, surgical and laboratory products, and provides services to hospitals, ambulatory surgery centers, clinical laboratories and other healthcare providers. This segment also manufactures, sources and develops its own Cardinal Health brand medical and surgical products. It provides post-acute care management and transition services, and software to hospitals. CAH has a market cap of $21 billion.
Earnings and Sales Growth: Over the last twelve months, earnings for CAH declined by -6.3%, while sales also dropped, by -1.78%. In the last quarter, earnings declined almost -36%, while sales dropped -6.3%. CAH’s margin profile has been troubled, but appears to be improving; over the last twelve months, Net Income was -2.42% of Revenues, but improved to 1.79% in the last quarter. This is a reversal that is worth watching in upcoming quarters; if the quarterly numbers continue to be positive, or even better, keep improving, this would be a strong sign that the company’s profitability is becoming healthier, and the negative pattern over the last twelve months is probably just a simple reflection of broader economic challenges than any actual problems in the way management runs the business.
Free Cash Flow: CAH’s free cash flow over the trailing twelve month period was $1.58 billion, marking a decline from $1.85 billion in the quarter prior. The current figure translates to a healthy Free Cash Flow Yield of 10.51%.
Debt to Equity: CAH has a debt/equity ratio of 3.78. This is a very high number, implying that CAH is very highly leveraged. The company’s balance sheet, however is a source of fundamental strength under current economic conditions. Total long-term debt is about $6.8 billion, while cash and liquid assets are about $2.7 billion. CAH’s healthy cash position gives it a good buffer against its narrow (albeit improving) operating profile and means there should be no problem at present servicing its debt; however the current Net Income pattern also bears watching, as a shift in the quarterly metric to a negative number will work against the company’s cash position.
Dividend: CAH pays an annual dividend of $1.94 per share. At the stock’s current price, that translates to a dividend yield of about 3.76%.
Price/Book Ratio: there are a lot of ways to measure how much a stock should be worth; but I like to work with a combination of Price/Book and Price/Cash Flow analysis. Together, these measurements provide a long-term, fair value target around $45 per share. That means the stock is overvalued, with about -11% downside from the stock’s current price.
Technical Profile
Here’s a look at CAH’s latest technical chart.
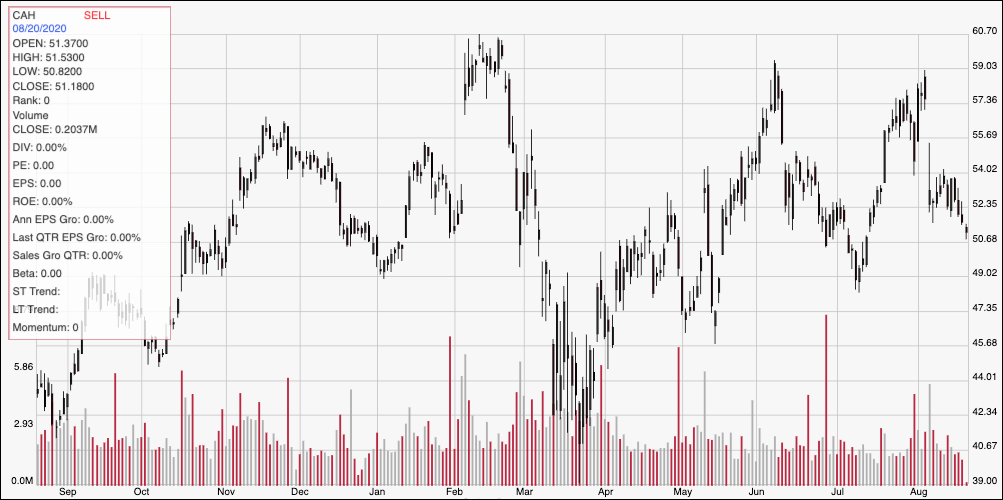
Current Price Action/Trends and Pivots: The chart above displays the last year of price activity for CAH. The upward trend from March to June is clear, with the stock dropping back sharply into the beginning of July to a pivot low around $49 before reversing back again to a high at around $59 per share. The stock then rallied back to about $59 at the beginning of this month before falling back again, and is low about $1.50 above July’s pivot low point. Immediate resistance is around $54, with support at $49. A push above $54 has good upside back to that previous peak at $59, while a drop below $49 could give the stock room to drop to around $45 where next support lies based on a pivot low in May.
Near-term Keys: If you prefer to work with short-term trading strategies, the best opportunity on the bullish side would come from a push above $54; that could be a good signal to buy the stock or work with call options with an eye on $59 as a near-term target. A bearish signal would come from a drop below $49; in that case you could consider shorting the stock or buying put options, using $45 as a good bearish profit target. I think that some of the challenges to CAH’s fundamental profile are reflective of broader economic concerns rather than any real problems in their business model or management approach; the company’s solid balance sheet is a good counter to any negative perceptions that may come from other fundamental metrics. Unfortunately, however that doesn’t translate to a useful value proposition for the stock; it would actually need to fall to around $36 to offer a useful discount.