The last few weeks appear to have brought uncertainty back to the market. Rising infections in a number of states seem to coincide with the reopening of schools, with the demographics showing most of those infections coming among teen to college-age young people. To some, that might not sound like a big deal, but it does beg questions about how much those current numbers may ripple to older, at-risk demographics. Doubt seems to be increasing that Congress will break its deadlock and find any compromise on a second round of stimulus that many experts say is needed if small businesses and individuals affected by long-term unemployment are to survive as long the health crisis keeps certain types of economic and social activities restricted. The Fed has committed to keep rates at or near zero through 2022 to support economic recovery, but as chairman Jerome Powell pointed out a couple of days ago, the Fed can only do so much. With the presidential election coming in just a few months, the rhetoric and finger-pointing from both sides of the aisle doesn’t seem to encourage the idea that any new stimulus will be coming before the end of the year.
It seems like every new wave of fresh news that reinforces the long-term nature of the health crisis gives a new push to the tech stocks that have led the market higher following the bear market bottom in March. Continued need to work at home and keep using remote networking and collaboration tools only seem to feed the fuel that has driven this segment of the Tech sector well above their pre-pandemic highs. You would think that is a pattern that might ripple across the sector, but one of the things the market has always been able to do is to differentiate between companies that should benefit from current market conditions and which ones are more likely to struggle.
One of the stocks that I think is a good example is Hewlett Packard Enterprise Company (HPE). When you think Hewlett Packard, you likely think first about laser printers and laptop computers; but HPE focuses specifically on enterprise-level computing and technology solutions. Think servers, cloud storage, and networking solutions, and you get an idea of where HPE lives. This is an area that, despite its important niche in business operations, has continued to be challenged by increasing competition and slow customer adoption of its service offerings. As a result HPE has diverged from its sector and industry patterns; for the last several months, HPE has hovered in a sideways range between about $9 to $10 per share, with only a single, brief push to about $11.50 in June. Is that sideways range an indication of a stock that should eventually break out, with a great value proposition to add fuel to the fire? I’m not sure; the stock has some challenges in its fundamental profile that I think have yet to be overcome and could keep bullish investors from diving in.
Fundamental and Value Profile
Hewlett Packard Enterprise Company is a provider of technology solutions. The Company’s segments include: Enterprise Group, Software, Financial Services and Corporate Investments. The Enterprise Group segment provides its customers with the technology infrastructure they need to optimize traditional information technology (IT). The Software segment allows its customers to automate IT operations to simplify, accelerate and secure business processes and drives the analytics that turn raw data into actionable knowledge. The Financial Services segment enables flexible IT consumption models, financial architectures and customized investment solutions for its customers. The Corporate Investments segment includes Hewlett Packard Labs and certain business incubation projects, among others. HPE has a current market cap of $12 billion.
Earnings and Sales Growth: Over the past year, earnings decreased -29%, while sales declined about -5.5%. In the last quarter, earnings improved, moving 45% lower, while sales grew by almost 13.5%. The company’s operating margins are a concern, with Net Income as a percentage of Revenues for both the last twelve months and the most recent quarter running positive, but scarcely above 0%. It’s worth noting however, that as recently as June, Net Income was negative on both a trailing twelve month and last quarter basis; Net Income was -0.13% over the trailing twelve month, with the negative pattern accelerating in the prior quarter to -13.66%. This could be an indication that, while the company continues to battle significant challenges to its operating profile, it could be turning a corner to greater profitability moving into the latter part of the year.
Free Cash Flow: HPE’s Free Cash Flow is generally healthy, at $1.2 billion over the last twelve months. This number is markedly lower than the $1.74 billion HPE registered in January of this year for Free Cash Flow, but also increased over the last quarter from $939 million. On a Free Cash Flow Yield basis, the current number translates to 10.38%.
Debt to Equity: HPE has a debt/equity ratio of .85, which is generally a conservative number, but also marks an increase from January of this year when debt/equity was .54. Their balance sheet shows $8.4 billion in cash (up significantly from $5.1 billion in June) against $13.7 billion in long-term debt (versus $11.5 billion in June). The increase over the last quarter follows a pattern of increased cash and debt throughout the year, which is a strong indication that HPE has increased its debt in order to build up cash. I take that as an indication the company is working to increase its liquidity in order to maintain its operations while it works to improve its negative operating profile. That is probably a positive thing in the long term, but in the near term it is also a reflection of the struggles the company is facing. I would prefer to see debt being reduced, while cash stabilizes or grows via improving Net Income and Free Cash Flow, which would be taken as a good signal profitability is becoming stronger.
Dividend: HPE pays a dividend of $.48 per share, which translates to an annual yield of about 5.27% at the stock’s current price. HPE’s dividend payout right now is higher than their earnings per share over the last year, which naturally calls into question how sustainable the dividend is.
Price/Book Ratio: there are a lot of ways to measure how much a stock should be worth; but I like to worth with a combination of Price/Book and Price/Cash Flow analysis. Together, these measurements provide a long-term target at about $13.50 per share. That suggests the stock offers a tempting discount, being undervalued by about 45% right now.
Technical Profile
Here’s a look at the stock’s latest technical chart.
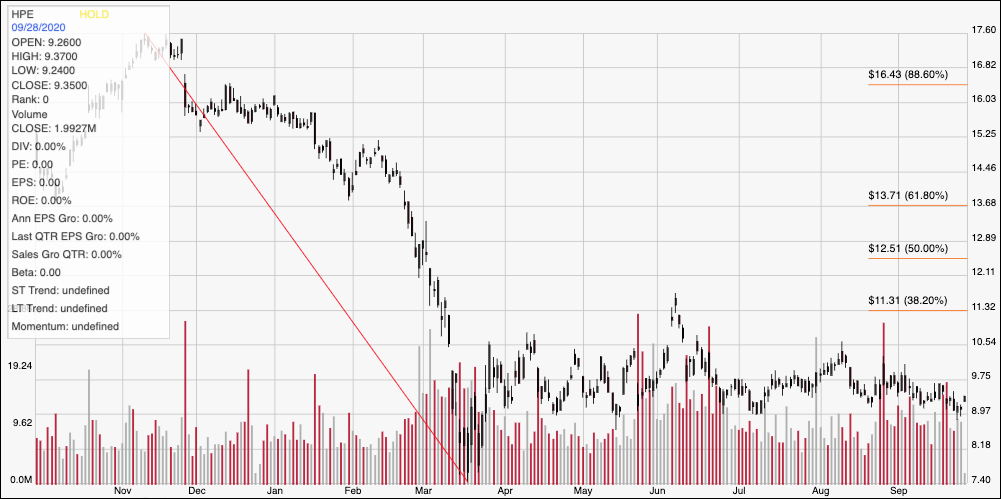
Current Price Action/Trends and Pivots: The chart above covers the last year of price action for HPE. The diagonal red line follows the stock’s downward trend from a peak in November at $17.50 to its low in mid-March around $7.40. It also provides the baseline for the Fibonacci retracement levels shown on the right side of the chart. The stock rallied by the beginning of April to a high at around $10.50 before sliding back to the low around $9 that defined the stock’s sideways pattern through the beginning of this month. In June, the stock managed to push above the 38.2% retracement line at around $11.30 before dropping back and settling back into its trading range. In the last month, in fact, the range has tightened, with resistance sitting around $10 and support right around $9. The stock would need to drive above the 38.2% retracement line, to about $11.50 to provide a useful sign that the stock is building enough bullish momentum to officially break the current consolidation range, with upside from that point to about $13 per share based on pivot lows in that area last summer. A drop below $9 would act as a strong signal that the stock is picking up bearish momentum, and should test its multi-year low around $7.50.
Near-term Keys:, HPE is a stock with a value proposition that is clearly tempting, and is even bolstered by some interesting fundamental metrics that offers signs the company is stronger than its price pattern suggests. I do remain concerned about the company’s Net Income pattern, and I think remains a big hole in the stock’s real value argument. I would wait to see Net Income continue to grow and expand before taking any actual value proposition the stock may offer seriously. That also means that the best probabilities of success lie in short-term trades. If the stock can pick up new bullish momentum and push above $10, and you don’t mind being aggressive, you might consider buying the stock or working with call options using $11.50 as a quick exit point. A drop below $9, on the other hand could be a signal to consider shorting the stock or buying put options, using the stock’s low around $7.50 as a profit target on a bearish trade.