One of the really remarkable stories about 2020 in the stock market is the way that the Tech sector has led the way after a pandemic-induced drop to bear market levels back to new highs. The biggest winner over the last eight months has been the Tech sector, where a number of stocks not only recovered their pre-pandemic highs but even surged to entirely new highs as investors piled into just about anything with even a tangential relationship to the global business shift to remote, cloud-based operations.
This shift is one of the most interesting economic trends of the year that has helped keep much of the corporate world going. Many companies have transitioned all or at least the majority of their business operations – at least, in “white-collar” areas where employees don’t have to be on-site – to remote, telecommuting functions. While unemployment has remained high, shifting major portions of the workforce to a telecommuting model has also saved millions of jobs and helped to keep a lot of other businesses running. That is part of the reason that companies that provide remote technology products and solutions have seen big increases in price over the last month. It has also spurred a sizable boost for businesses tied to streaming services. As you drill down, that doesn’t just mean the Netflixes or Amazons of the tech world, but it also means that companies on the production and supply side of those solutions – including semiconductors, which are generally very sensitive to economic downturns – have been favorably positioned.
In the semiconductor space, I like to pay attention not just to the producers – Intel, Advanced Micro Devices, Samsung Electronics, and so on – but also the companies that provide solutions and services to aid their production. That means equipment makers, like Applied Materials Inc. (AMAT) are always of interest. AMAT has been among the star performers after hitting a bear market low at around $36 in March – it more than doubled in price from that point until it touched $70 in mid-August – matching its February high before the pandemic took hold. From that point, the stock dropped back to around $54 before picking up a new head of steam at the beginning of November. Talk about giving a horse its head – the stock has moved from about $56 to a current price around $82 as of this writing. While that big move is great for investors who already held shares before then, what does it mean now? Do the company’s fundamentals support the argument for a higher price, or has this massive rally flipped the reward: risk equation against taking a new position now?
Fundamental and Value Profile
Applied Materials, Inc. provides manufacturing equipment, services and software to the global semiconductor, display and related industries. The Company’s segments are Semiconductor Systems, which includes semiconductor capital equipment for etch, rapid thermal processing, deposition, chemical mechanical planarization, metrology and inspection, wafer packaging, and ion implantation; Applied Global Services, which provides integrated solutions to optimize equipment and fab performance and productivity; Display and Adjacent Markets, which includes products for manufacturing liquid crystal displays, organic light-emitting diodes, upgrades and roll-to-roll Web coating systems and other display technologies for televisions, personal computers, smart phones and other consumer-oriented devices, and Corporate and Other segment, which includes revenues from products, as well as costs of products sold for fabricating solar photovoltaic cells and modules, and certain operating expenses. AMAT has a current market cap of $74.2 billion.
Earnings and Sales Growth: Over the last twelve months, earnings increased by a little over 56.25%, while sales improved by about 25%. That strong pattern was also seen in the last quarter; earnings increased nearly 18% while sales increased 6.67%. That earnings patterns has continued to reflect, at least in part, generally improving conditions in the memory market, where oversupply had previously been a big concern. The company’s margin profile is impressive; Net Income versus Revenue was 21.04% over the last twelve months, and strengthened to 24.13% in the last quarter.
Free Cash Flow: AMAT’s Free Cash Flow is strong, at almost $3.4 billion. While this number declined from about $7 billion at the beginning of 2018, it is also up from around $2.5 billion at the end of 2018. It also translates to a Free Cash Flow Yield of 4.83%.
Debt to Equity: AMAT has a debt/equity ratio of .52, which is conservative, and implies debt management shouldn’t be a problem. The company has nearly $5.7 billion in cash and liquid assets, which means they they have plenty of liquidity, against $5.4 billion in total long-term debt.
Dividend: AMAT pays an annual dividend of $.88 per share – an improvement from $.80 in 2019 – and which, at its current price translates to a dividend yield of about 1.09%.
Price/Book Ratio: there are a lot of ways to measure how much a stock should be worth; but I like to work with a combination of Price/Book and Price/Cash Flow analysis. Together, these measurements provide a long-term, fair value target around $43 per share. That means that AMAT is significantly overvalued, with about -47% downside from its current price. It also puts a bargain price for the stock at around $34.
Technical Profile
Here’s a look at the stock’s latest technical chart.
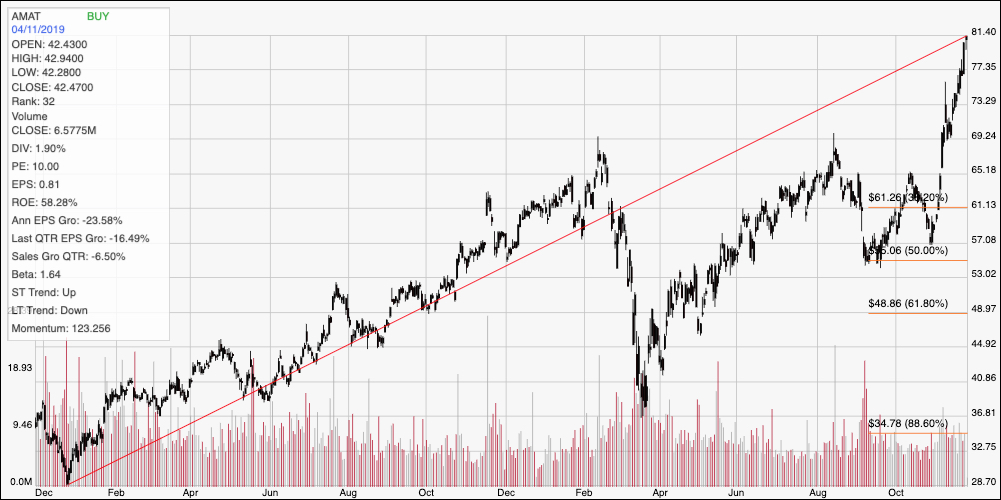
Current Price Action/Trends and Pivots: The chart above covers the last two years of price activity. The red line traces the stock’s upward trend throughout that period to its current high at around $81. It also provides the baseline for the Fibonacci retracement lines shown on the right side of the chart. Considering the stock’s current momentum, it can be hard to estimate current support or resistance levels on a practical basis; but the parabolic nature of the move should make you wonder if the stock’s near-term momentum is sustainable. The stock’s bounce off of support at around $56 saw the stock push to about $73 – a $17 per share gain – before finding a pivot high, which could provide a useful reference point. It dropped to about $69 before rebounding again to its current level and has increased about $13 per share from that point. That could put a near-term peak anywhere between the stock’s current price and $86. If that happens, I doubt the stock would be able to maintain the exaggerated upward slope it is currently on, which means that I would look for support somewhere between $73 and $69.
Near-term Keys: If you prefer working with short-term, momentum-based trades, I think the current difference between likely support and resistance suggests that the stock offers about $4 of upside (at the most) versus $9 to $13 of downside right now. That puts the stock’s current reward: risk at somewhere between 1:2 or 1:3. That means that the probabilities of success in bullish trades right now very, very low. A pivot high anywhere between the stock’s current price and $86 could offer an opportunity short the stock or to buy put options for a an aggressive, bearish short-term trade, with a target price somewhere between $73 and $69. What about the value proposition? AMAT’s fundamentals are solid; but given the stock’s current overvalued status, there is really no way to think about AMAT as any kind of useful long-term buy right now.