Sometimes, answering the question of whether a stock represents a legitimate, attractive value opportunity can be hard to do. A company could be struggling not only to grow its business, but may be forced to restructure its business in a way that makes most of the traditional measurables investors like to use look very unfavorable. Strict, quantitative value and fundamental analysis would dictate that you stick to the numbers, and that you distrust anything but what the numbers tell you. That isn’t always the most sensible thing to do, however simply because business isn’t always just about the numbers.
It isn’t that the numbers – sales, earnings, free cash flow, debt, and so on – aren’t important, because of course they always are. They help to frame a company’s business over any given period of time in a useful context. Sometimes, however, you also need to be able to look beyond the limits of what that context may describe. It can be important to remember that the numbers that make up fundamental and value-based measurements are almost always historical in nature; even forward-looking measurements and estimates tend to rely on past performance to provide a framework for what a company might be able to do in the future. This is really where one of the challenges of stock market and value-based analysis is greatest, because this is really more art than science.
It might sound like I’m talking about trusting your gut, or being willing to compromise on some of the fundamental criteria you usually use to guide your investment decisions, but I don’t really like to do either of those things. As an investor, my gut tends to be wrong more often than it’s right; that is one of the reasons that over the course of my investing career I moved away from even more subjective, low-probability methods like short-term swing, trend or momentum trading. And giving in to the temptation to make allowances for poorer measurables is an emotional response that will make it harder to think objectively about what you should do if the time comes to call a bad investment what it really is. All that said, I do think that there are cases from time to time where a stock’s fundamental strength or value opportunity is hard to quantify by measurables alone.
Signet Jewelers Ltd (SIG) is an interesting example of what I mean. This is a stock that, after finding its March, bear market bottom at around $5.50, has increased in value by nearly six times as of this writing. Since early 2016, however, the stock is down nearly 81% from an all-time high at around $150 per share. That means that even with the strong increase in price over the last eight months, the stock remains in an extremely extended, long-term downward trend. Much of that decline can be attributed to internal problems, such as pay discrimination and sexual harassment lawsuits that prompted a change in executive leadership in 2017, as well as required adjustments to shifting consumer trends away from traditional mall shopping, even for luxury items like jewelry to more digital settings. The company had been making progress in implementing a comprehensive transformation plan begun by its new CEO in 2017 – at least until COVID-19 came to play this year.
While SIG has undoubtedly seen a big impact on its business from forced shutdowns of retail locations – which management has indicated remain a potential pain point in quarters ahead as infections have been surging – the company’s balance sheet has remained remarkably resilient, with manageable debt and healthy liquidity as well as Free Cash Flow, Combined with the stock’s upward rise this year against the longer downward trend, that could be setting up a very interesting technical, fundamental and value base for a new potential long-term upward trend. Near-term risks remain, of course; but as vaccines are starting to be deployed around the world, with expected approval coming this week for the first vaccine candidate in the U.S., looking at 2021 as the year that the world can start to resume “normal” activities – like social gatherings that have been put on hold in 2020 – starts to make more sense. That means that broad trends may be likely to shift back in SIG’s favor (think, for example, of marriages and their celebrations that many couples have been forced to delay because of COVID). Does that make the stock an overall terrific value, or a high-risk value trap? You decide.
Fundamental and Value Profile
Signet Jewelers Limited is a retailer of diamond jewelry. The Company’s segments include the Sterling Jewelers division; the Zale division, which consists of the Zale Jewelry and Piercing Pagoda segments; the UK Jewelry division, and Other. The Sterling Jewelers division’s stores operate in the United States principally as Kay Jewelers (Kay), Kay Jewelers Outlet, Jared The Galleria Of Jewelry (Jared) and Jared Vault. The Zale division operates jewelry stores (Zale Jewelry) and kiosks (Piercing Pagoda), located primarily in shopping malls across the United States, Canada and Puerto Rico. Zale Jewelry includes the United States store brand, Zales, and the Canadian store brand, Peoples Jewellers. Piercing Pagoda operates through mall-based kiosks. The UK Jewelry division operates stores in the United Kingdom, Republic of Ireland and Channel Islands. The Other segment includes the operations of subsidiaries involved in the purchasing and conversion of rough diamonds to polished stones. SIG’s current market cap is $1.5 billion.
Earnings and Sales Growth: Over the last twelve months, earnings increased nearly 114.5%, while sales improved by 9.5%. In the last quarter, earnings were nearly 110% higher, while sales grew 46.4%. The company has been operating for most of the year with negative Net Income on a yearly basis, as Net Income was -1.59% of sales; however in the last quarter Net Income turned positive. The amount isn’t significant – only 0.72% – but the turn to positive follows consistent quarterly numbers that have been strongly negative. This could be an early sign that the company is poised to return to long-term profitability.
Free Cash Flow: SIG’s free cash flow is very attractive, at more than $967 million for the trailing twelve month period; that translates to a Free Cash Flow yield of more than 65% and that provides some relief from the company’s mixed margin profile.
Debt to Equity: SIG has a debt/equity ratio of 1.13, which sounds high, especially when you consider that, prior to 2020, SIG consistently took a conservative philosophy about leverage, but the increase isn’t as negative as it may seem. For perspective, consider that in late 2018, SIG held only about $134 million in cash and liquid assets versus $671.1 million in long-term debt. As of the last quarter, cash and liquid assets were $1.3 billion while long-term debt was $1.03 billion. It appears clear that management borrowed at the beginning of 2020 to bolster its balance sheet against the broader declines it anticipated in the wake of the pandemic, as long-term debt jumped from a little over $500 million at the beginning of the year to a peak two quarters ago at $1.33 billion; but consider that management also repaid $300 million of that debt in the last quarter while total cash increased, and it’s easier to suggest that debt management won’t be a problem.
Dividend: SIG suspended its dividend in early 2020 to preserve cash, with no indication of when management plans to reinstate it.
Price/Book Ratio: there are a lot of ways to measure how much a stock should be worth; but I like to worth with a combination of Price/Book and Price/Cash Flow analysis. Together, these measurements provide a long-term target at about $39 per share. That suggests that the stock is nicely undervalued, by about 37%.
Technical Profile
Here’s a look at the stock’s latest technical chart.
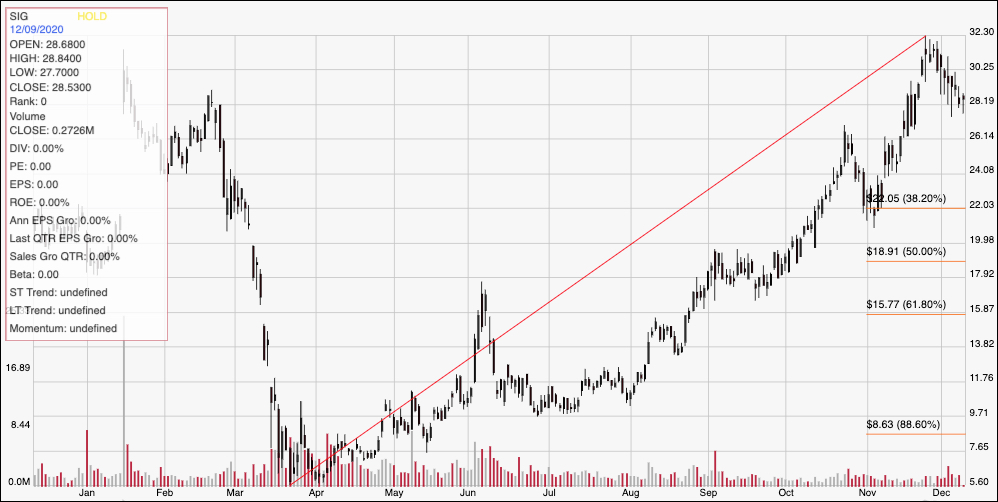
Current Price Action/Trends and Pivots: The chart above traces the stock’s downward trend over the last year. The red diagonal line traces the stock’s upward trend from its bear market low at around $5.50 in March to its peak a couple of weeks ago at around $32. It also provides the baseline for the Fibonacci retracement lines on the right side of the chart. The stock has retraced from that peak by about $4 per share, and could be approaching support based on February pivots around $28. The peak at $32 provides the most likely immediate resistance level. A pivot and move higher off of support anywhere around $28 could see the stock rally back to retest that $32 high, while a drop below $28 should find next support at around $26. If that level doesn’t hold, however, next support is down around the 38.2% retracement line, which is sitting at around $22 per share.
Near-term Keys: The stock’s strong intermediate bullish trend pattern, along with the outsized value proposition make this a tempting stock to consider using for a bullish trade. If the stock can pivot back to the upside, a bounce anywhere around $28 per share should see it push fairly easily back to the recent peak at $32, which could a good opportunity to buy the stock or work with call options. If the stock drops below $28 per share, it would act as a strong bearish signal to consider shorting the stock or buying put options, with downside to $26 or $22 if bearish momentum accelerates. What about the value proposition? The company’s fundamentals are strong enough, with signs that profitability is improving that I think the stock offers some interesting long-term opportunities, even with the stock’s big increase in the last several months. If you don’t mind dealing with near-term uncertainty and potential volatility through the early part of 2021, this could be a stock to take very seriously.