One of the classic benchmarks of the economy’s health and strength is the housing market. Stocks of retail companies like Home Depot (HD) and Lowe’s (LOW) often serve as proxies of to guide the market’s perception of the housing market, but it also isn’t uncommon to see experts and analysts referring to homebuilders like D.R. Horton (DHI) and Toll Brothers (TOL) in the same way. Throughout almost all of last year, homebuilding stocks underperformed the broad market, but since that point the sector has followed the pattern of most of the rest of the market higher.
Another interesting segment of the Homebuilding industry, by extension of healthy demand in both new and existing housing over the past few months, is in homebuilding suppliers. Owens Corning (OC) is a leader in the Building Products sub-industry. This is an industry that benefits from a robust market in new home purchases as well as in remodeling of existing homes, which is why stocks like OC are usually a good barometer for broader economic health.
2020 has seen an interesting mixture of economic and health crisis, along with remarkable innovation, creativity, and resilience that can all be tied in one form or another to the global pandemic that is COVID-19. One of the remarkable pockets of the economy that has been surprisingly resilient is the Homebuilding industry. Despite historically high unemployment numbers (that are threatening to move back higher in 2021 if new federal stimulus that includes assistance for already out-of-work Americans as well as additional small business relief is stonewalled yet again), the housing market has seen high demand in a lot of areas of the U.S. That is driven at least in part by Federal Reserve policy that has held interest rates near zero and committed publicly to continue its accommodative path for as long as it deems necessary to support the economy. That is one of the reason that OC, like a lot of stocks in this industry have seen increases in price of 200% or more from their early, COVID-driven bear market lows.
OC is right in that mix. The stock dropped to levels not seen since late 2014 at around $28 in March, but has not only reclaimed the distance it lost since then, but also moved more than $10 per share past its pre-pandemic high point. For those investors that had the foresight to buy this stock at or near those March lows, the stock’s current price provides an outstanding dinner party story; but does that mean that the opportunity is over for this stock, or is there more upside ahead?
OC is a stock with some interesting fundamental reasons to make the stock worth paying attention to. It is also true that with vaccines being deployed across the country, interest rates remaining low, and unemployment trending in a positive direction despite continued risks, there is an argument to make for continued strength in the housing market in 2021. If that proves out, these elements could give the stock a much greater chance to build even further on the strength it has already built. So where does OC fit in to a long-term investing approach: as a growth stock, or a solid value opportunity?
Fundamental and Value Profile
Owens Corning is engaged in the business of composite and building materials systems, delivering a range of products and services. The Company’s products range from glass fiber used to reinforce composite materials for transportation, electronics, marine, infrastructure, wind-energy and other markets to insulation and roofing for residential, commercial and industrial applications. The Company’s segments include Composites, Insulation and Roofing. The Composites segment sells glass fiber and/or glass mat directly to a small number of shingle manufacturers. Its insulating products include thermal and acoustical batts, loosefill insulation, foam sheathing and accessories, and these are sold under brand names, such as Owens Corning PINK FIBERGLAS Insulation. The primary products in the Roofing segment are laminate and strip asphalt roofing shingles. Its other products include oxidized asphalt, roofing components and synthetic packaging materials. OC has a current market cap of about $8.5 billion.
Earnings and Sales Growth: Over the last twelve months, earnings increased by 4.3%, while revenue growth was just about 1%. On a quarterly basis, earnings grew by more than 93%, while revenues increased by a little over 17%. The company’s margin profile shows both the effect of early, pandemic-induced restrictions and shutdowns as well as an apparent turnaround back to profitability; over the last twelve months Net Income as a percentage of Revenues was -7.94%, but improved to 10.82% in the last quarter.
Free Cash Flow: OC’s free cash flow is healthy and has improved throughout the course of the year. For the trailing twelve months, Free Cash Flow was $893 million in the last quarter, improving from about $732 million at the beginning of the year. The current number also translates to a Free Cash Flow Yield of 11.12%.
Dividend: OC’s annual divided is $1.04 per share, which translates to a yield of 1.34% at the stock’s current price. It is worth noting that in late 2019, the dividend was just $.88 per share, per annum, meaning that despite the pressures of this year, OC has managed to raise its dividend when many other companies have been forced to reduce or eliminate dividend payments altogether.
Price/Book Ratio: there are a lot of ways to measure how much a stock should be worth; but I like to work with a combination of Price/Book and Price/Cash Flow analysis. Together, these measurements provide a long-term, fair value target around $77 per share. That means the stock is fairly valued, sitting about -2% above that level right now.
Technical Profile
Here’s a look at the stock’s latest technical chart.
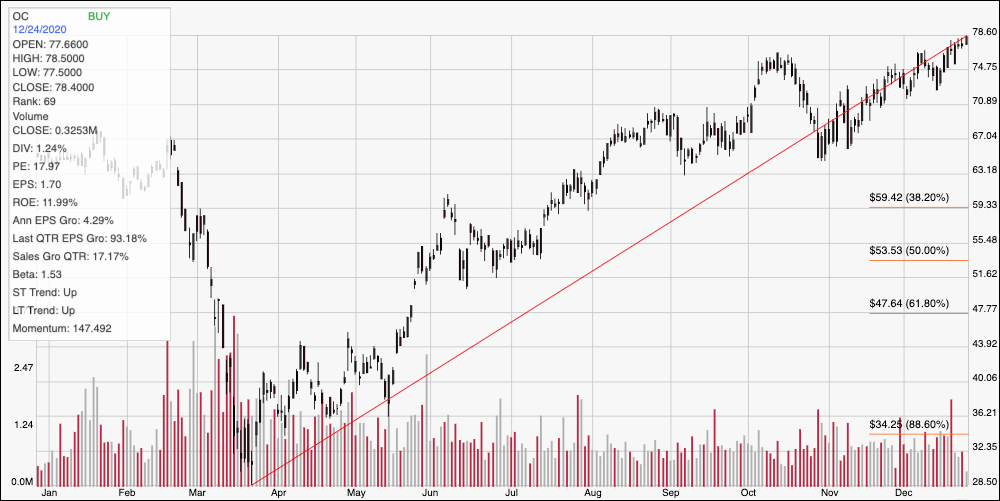
Current Price Action/Trends and Pivots: The red diagonal line measures the length of the stock’s upward trend from a March low at around $28.50 to its current 52-week high at about $78.50; it also informs the Fibonacci trend retracement lines shown on the right side of the chart. The stock only recently broke above its closest resistance at about $75, which marks the stock’s expected new immediate support level. A drop below that point should see the stock fall to about $71, based on previous pivot activity before finding next support. The distance between $71 and $75, which was the distance between the most recent levels of support and resistance, also provide a benchmark for gauging how much upside the stock may have if bullish momentum remains strong; that puts expected next resistance at around $79, just a little away from the stock’s current price. That also means that a push above $79 should see additional upside to about $83 per share.
Near-term Keys: Watch the stock’s activity from this point. You can take a drop below $75 as a sign that the stock’s newest support level isn’t holding, which could provide a strong signal to short the stock or start working with put options with a target price around $71. The best signal for a bullish trade would come a break above $79; that could provide an opportunity to trade the expected distance between last support and resistance to a new peak in the $83 range. Despite the company’s generally solid fundamentals, however, the stock is trading a little above its fair value target, which means that any bullish upside the stock may have must be considered on the basis of growth alone rather than value. For a value-focused investor, the stock would actually have to drop to about $61.50 to offer a useful bargain opportunity.