One of the challenges that investors have had to deal with throughout the past year is the market’s divergence from economic facts on the ground. From the early stages of the pandemic, analysts could not agree whether the expected, eventual recovery from both a health and economic-driven perspective would manifest as by a move back up in proportion to the rapidity and severity of the initial decline (in charting terms, forming a V-shape), a more gradual, long-term but steady increase (a U-shape) or, possibly even just a drop followed by an extended period at low levels (an L-shape). The market clearly formed a V-shape, with all of the major indices reclaiming their pre-pandemic highs, and driving to new ones in September of 2020 and setting a pattern of continued highs from November through current market conditions. In the meantime, infection rates haven’t decreased or stabilized – they’ve gone up across the world even as vaccines are being administered. The rise has prompted the U.K. to impose new shutdown restrictions, and in the U.S. health care facilities are being stretched to their limits.
The economic data is just as mixed. Unemployment has been improving steadily for most of the past six months, but still remains historically high, with an increasing level of concern focused around the survivability of small businesses the longer the crisis continues and questions about the potential for an increase in rental defaults and resulting evictions for both commercial and residential properties. A new second set of stimulus was approved by Congress before the end of 2020, and the Fed has repeatedly stated its intention to maintain its accommodative monetary policy for as long as necessary, while certain businesses have found way to evolve and even prosper amid the pandemic that has forced most to shift their business operations and models. Even so, the major indices are either at fresh, new all-time highs as of this writing or within spitting distance of highs set just a few days ago.
It is interesting to observe the disconnect between broad stock market expectations versus the economic data that points to a much more gradual pace of economic growth. One of the places where I think that can be seen more easily is in evaluating large-cap versus small-cap stocks. Many of the biggest and most recognizable names in the market have followed the broad indices higher, and if you look at the fundamentals of many of those companies, there are clear indications that they have been able to navigate the uncertainty of the past year better than their smaller brethren. That isn’t surprising, and it is a natural reason any smart investor, myself included, focuses on many of these companies first under these kinds of market conditions.
Small-cap stocks can be harder to evaluate – not because their management teams are less capable, or exercise less financial discipline, but simply because the size, scale and breadth of their respective businesses are usually more narrowly focused. That can put those companies at greater risk to forces – such as coronavirus – that may be entirely out of their control. The divide can become even wider if the sector or industry the company operates in also happens to lie on the wrong side of shifting economic winds.
The market has proven that over the last year, all sectors are not created equal. There are sectors that have held up extremely well even as global economic shutdowns sent workers home and closed just about every kind of traditional business activity. Those include companies that offer services and solutions that facilitate remote organizational connectivity and collaboration, which have helped a large portion of corporate America continue to function even while normal, in-office operations haven’t been possible. That shift has helped shield many of those companies from the worst economic impacts of the pandemic, but also looks like it could translate to a long-term shift away from traditional business operations, creating a ripple effect that could impact other businesses in a negative way.
One of the business segments that has already seen a negative impact, and that could continue to be effected for an extended period of time is the Commercial Services and Supplies industry. These are businesses that provide products and services to organizations – such as businesses, schools, and governments – in traditional office settings, which means that the longer it takes America to get back to the office and back to in-person schooling, the longer it will take these companies to recover. That could mean that companies like ACCO Brands Corp (ACCO) may continue to struggle the longer a complete economic recovery takes. Along with the shift to remote work is the complexity most states have seen in reopening schools; across the United States, back to school has also corresponded with significant increases in infections among high school and college-age groups. ACCO’s management has previously highlighted school reopenings as an ongoing, likely headwind in its earnings reports – even more than remote work.
ACCO’s stock mirrored the broad market’s dip to bear market lows in March, with a sizable bounce from that point to create an interesting short-term upward trend into June that then flattened into a narrow trading range until the beginning of September. By the beginning of November, the stock had fallen back a bit below that consolidation range to find a new bottom at around $5.30 that has since provided a solid rally point, with the stock now pushing close to $9 per share. The question for a value-focused investor is whether their fundamental strengths add up to the resources the company will need to continue to weather a long-term decline in demand and make the shifts it will require? The answer to that question could define the difference between a great value opportunity and just a cheap stock.
Fundamental and Value Profile
ACCO Brands Corporation is engaged in designing, marketing and manufacturing of branded business, academic and selected consumer products. The Company operates through three segments: ACCO Brands North America, ACCO Brands International and Computer Products Group. The Company’s brands include Artline, AT-A-GLANCE, Derwent, Esselte, Five Star, GBC, Hilroy, Kensington, Leitz, Marbig, Mead, NOBO, Quartet, Rapid, Rexel, Swingline, Tilibra and Wilson Jones. The Company’s ACCO Brands North America and ACCO Brands International design, market, source, manufacture and sell traditional office products, academic supplies and calendar products. ACCO Brands North America consists of the United States and Canada, and ACCO Brands International consists of the rest of the world, primarily Northern Europe, Australia, Brazil and Mexico. Its Computer Products Group designs, sources, distributes, markets and sells accessories for laptop and desktop computers and tablets. ACCO’s current market cap is about $848.6 million.
Earnings and Sales Growth: Over the last twelve months, earnings declined about -40.5%, while sales decreased by about -12%. In the last quarter, earnings improved dramatically by 58% while revenues rose by 21%. ACCO’s operating profile before the pandemic set in was narrow, but generally healthy, but over the last couple of quarters has seen signs of significant deterioration. Over the last twelve months, Net Income was 4.37% of Revenues and narrowed slightly to 4.19% in the last quarter.
Free Cash Flow: ACCO’s free cash flow is healthy, at a little more than $128 million that is nonetheless a drop from $225.3 million in the quarter prior. The current number translates to a useful Free Cash Flow Yield of almost 16%. It is also worth noting that ACCO’s Free Cash Flow was just $40 million in March of 2019.
Debt to Equity: ACCO has a debt/equity ratio of 1.21. That is a high number that signals the company’s heavy reliance on leverage. Their balance sheet shows $876.3 million in long-term debt versus just about $86 million in cash and liquid assets. For now, the company should be able to service the debt it has; however deterioration of Net Income could force the company to extend their debt even further (which management indicates they have the ability to do) – in essence pushing the issue further out in time on the expectation that an eventual improvement in business activity will make up the difference.
Dividend: ACCO pays a dividend of $.26 per share, which translates to an annual yield of 3.05% at the stock’s current price. ACCO differs from many small-cap stocks in that it pays a dividend at all; it is also remarkable that management has maintain the dividend throughout the challenges of the past year.
Price/Book Ratio: there are a lot of ways to measure how much a stock should be worth; but I like to worth with a combination of Price/Book and Price/Cash Flow analysis. Together, these measurements provide a long-term target at about $9.92 per share. That suggests the stock undervalued by about 16% right now.
Technical Profile
Here’s a look at the stock’s latest technical chart.
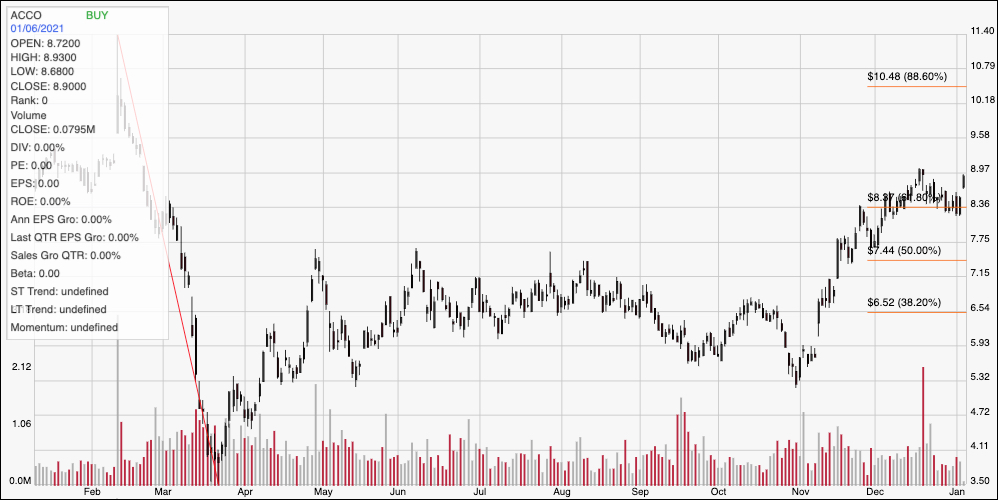
Current Price Action/Trends and Pivots: The red diagonal line traces the stock’s downward plunge from its high at around $11.50 last February to the stock’s low point, reached in mid-March at around $3.50. It also provides the baseline for the Fibonacci retracement lines on the right side of the chart. The stock rallied by the end of April to the 50% retracement line at around $7.50 before dropping back again, with a second bounce in mid-May providing a new push back to the 50% retracement line that went a little above it in June. In September the stock dropped below range support at around $6.50 to find new support at the end of October at around $5.50. From that point, the stock began a strong short-term upward trend that only recently peaked at about $9 per share. The stock is currently pushing close to that resistance level, where a break above it could offer upside to about $10.50 where the 88.6% retracement line sits. Current support is at the 61.8% retracement line around $8.35; a drop below that point could see the stock fall to about $7.50 where previous pivot points, along with the 50% retracement lie in wait to offer new support.
Near-term Keys: ACCO has an attractive value proposition, and some intriguing fundamental strengths that could make it a tempting target for a long-term opportunity. The continued uncertainty around the pandemic, along with questionable liquidity are significant red flags, however, along with management’s own expectation that the challenges they have faced in 2020 are likely to continue for the foreseeable future. I think that could depress the stock’s long-term upside prospects enough to say that the smart approach right now is hold tight. There could be an interesting short-term opportunity to buy the stock or work with call options if it can break above its current resistance at $9, with upside to $10.50, a little above where its “fair value” rests right now. Watch, however for a drop below $8.35; that could be a signal to consider shorting the stock or working with put options, using a level at around $7.50 as a useful profit target on a bearish trade.