One of the early threads of this new year, aside from commentary and opinion about the political landscape, rising COVID-19 infections (not to mention a new strain that appears to be more infectious than the first) is the way the Financial sector has been among the sectors that have led the market higher. Two weeks into 2021, financial stocks are up about 3.25% so far as measured by the U.S. Financials iShares ETF (IYF).
I believe that at least some of the momentum behind the sector’s move is tied to politics; winding closer to the official transition from a Trump to a Biden White House means that attention is starting to shift towards the incoming administration’s initial agenda. The President-elect has been open since the election about his belief that the economy and the health crisis are intrinsically linked to each other, and that long-term economic recovery is only possible when the pandemic is brought under control. Early indications are that for the incoming President, that means a more hands-on approach to vaccine distribution and deployment, where the Trump administration left most of the final details up to individual states.
Last night the President-elect unveiled his proposal for a new set of federal spending designed to support small business, provide aid to state governments, and allocate more resources to vaccine research, development and distribution. It also proposes additional unemployment support and direct checks. Whether or not the complete package is implemented will be seen after he is sworn in and the newly elected officials in Congress begin the process of debate and negotiation; but one of the things that will certainly be true is that the Financial sector will be involved in providing the vehicles to facilitate new small business loans and other aspects of whatever that ultimately looks like. Most of the biggest banks in the U.S. have experienced their fair share of pain over the last year, but have managed to weather the storm with strong balance sheets and even improve important measurement like Net Income over the last quarter.
One of the stocks in this sector that I like to pay attention to is U.S. Bancorp (USB). While this company will usually not get mentioned on news media when talking heads start talking about the largest banking institutions in the U.S., it is the 5th largest bank in the U.S. by deposits. A better-than-expected housing market in 2020 and continuing into this year are among elements of this company’s business that have provided tailwinds to its diversified revenue stream. They boast a very healthy balance sheet with liquid reserves well in access of debt obligations and a healthy dividend that makes tempting fodder for income-seeking investors. The stock itself has followed the sector higher in the last quarter of 2020, and is up almost 6% so far this year, yet remains about -13% its pre-pandemic highs. Does that mean that this is a stock that could also offer an attractive value opportunity? Let’s find out.
Fundamental and Value Profile
U.S. Bancorp is a financial services holding company. The Company provides a range of financial services, including lending and depository services, cash management, capital markets, and trust and investment management services. It also engages in credit card services, merchant and automated teller machine (ATM) processing, mortgage banking, insurance, brokerage and leasing. Its banking subsidiary, U.S. Bank National Association, is engaged in the general banking business and offers commercial and consumer lending, lending services, depository services and ancillary services. Its non-banking subsidiaries offer investment and insurance products to the Company’s customers principally within its domestic markets, and fund administration services to a range of mutual and other funds. The Company’s bank and trust subsidiaries provide a range of asset management and fiduciary services for individuals, estates, foundations, business corporations and charitable organizations. USB’s market cap is about $73 billion.
Earnings and Sales Growth: Over the last twelve months, earnings declined almost -14%, while sales dropped nearly -11%. In the last quarter, earnings increased almost 141.5% (not a typo) while sales were mostly flat, but -0.02% lower. Despite the declining earnings pattern over the past year, USB’s margin profile is very healthy and strengthening; Net Income as a percentage of Revenues was 19.02% over the last twelve months, and strengthened in the last quarter to a little over 25%.
Free Cash Flow: USB’s free cash flow was about $4.7 billion over the past twelve months and translates to a Free Cash Flow Yield of 6.33%. It is noteworthy that this number is around the same level it was reported at the end of 2019, which was $4.8 billion; but it is also below its high point in the first quarter of 2020 at $5.9 billion. This is a clear indication, strength from the company’s Net Income just described, that the challenges of a pandemic-driven economy have had its impact on this company’s operations.
Dividend Yield: USB’s dividend is $1.68 per share, and translates to an above-average yield of 3.41% at its current price.
Debt to Equity: USB has a debt/equity ratio of .90. This is a manageable number. Their balance sheet shows $44 billion in cash and liquid assets against about $42.4 billion in long-term debt. While debt is significantly below the $31 billion mark it saw in mid-2020, cash has also declined from about $52.3 billion in mid-2020.
Price/Book Ratio: there are a lot of ways to measure how much a stock should be worth; but I like to work with a combination of Price/Book and Price/Cash Flow analysis. Together, these measurements provide a long-term, fair value target just little under $38.50 per share. That means the stock is overvalued, with about -21% downside from the stock’s current price. It also puts the stock’s bargain price at around $31 per share.
Technical Profile
Here’s a look at the stock’s latest technical chart.
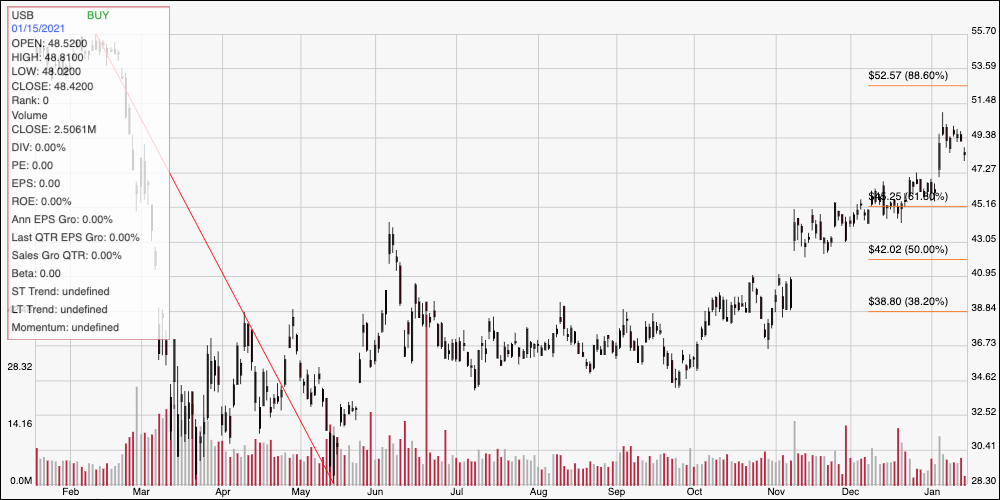
Current Price Action/Trends and Pivots: This chart traces the stock’s movement over the last two years. The diagonal red line traces the stock’s downward trend from its February 2020 high at around $56 to its pandemic-driven, bear market low at around $28. It also provides the baseline for the Fibonacci retracement lines shown on the right side of the chart. From that low, the stock rallied a bit in June before dropping into a narrow consolidation range that held into the beginning of October. At that point, the stock broke out of that range to move into a nice, intermediate-term upward trend that peaked last week at around $50 per share. The stock is retracing a bit from that high now, with immediate support around $47 and resistance at that $50 peak. A push above $50 could see the stock test next resistance at around $52.50 where the 88.6% retracement waits, with additional upside to the 52-week high at around $56 if bullish momentum remains strong. A drop below $47 should find next support at around $45, where the 61.8% retracement line rests, with additional downside to about $42 if bearish momentum accelerates.
Near-term Keys: Given the stock’s momentum, the best probabilities of success right now lie clearly on the bullish side USB – but the smart bet is to wait to see if the stock can push above its recent peak at $50. That would provide a good signal to buy the stock or work with call options, using $52.50 as a good, quick-hit profit target and $55 to $56 beyond that if bullish momentum continues. A drop below $47 could be used to think about shorting the stock or buying put options with an eye on next support at $45 as an initial profit target and $42 if it keeps dropping. Despite USB’s overall fundamental strength, its stock price is clearly overvalued, which means that if you want to think about USB as a long-term investment opportunity, it really fits into a growth stock description more than a value-based one.