Through just about the entire nine-month period in 2020 from a bear market low to the beginning of 2021, one of the best-performing sectors in the market has been the Materials sector. Over that time, the sector more than doubled in value, as measured by the S&P 500 Materials Sector SPDR (XLB). This is a sector that I like to pay attention to, along with a few others, as a barometer for the underlying, relative health of the economy, because the companies that comprise it produce or mine the building blocks used to create most of the finished goods we use every day. The sector includes industries that cover chemicals and plastics, construction materials, paper, forest, and packaging products, as well as metals and minerals – which means that in some form, this sector touches practically every other segment of the economy in one more or another.
From that January peak, however the sector has faded back a bit as uncertainty about vaccination progress, and how long the pandemic will continue to effect economic activity have increased. The status of a Biden-promised and proposed new stimulus package built on top of the one Congress approved in December remains unclear, even as indications that many small businesses that have been forced to close their doors during the pandemic may never reopen. While many larger companies have found creative ways to keep business moving during the health crisis, or rely on the strength of their financial resources to weather the worst effects of the downturn, small businesses continue to be the leading creator and source of new jobs; the longer those businesses can’t function because of health concerns, the longer unemployment, which remains around 10.7 million persons as of the end of December will remain more than double pre-pandemic levels, and significantly above the peak levels seen in the Great Recession of 2007-2009.
With or without a major, new stimulus package, the government is going to need to look for ways to stimulate growth in productive ways. One of the most time-proven, cost-efficient methods in the long-term is infrastructure investment, particularly mass transit. That kind of fiscal policy investment bleeds into a number of industries, which means that industries from Metals & Mining to Construction and Heavy Machinery could be a good position to benefit.
Steel Dynamics Inc. (STLD) is an interesting company in the Metals & Mining industry of this sector. This is a company with a solid balance sheet and fundamental numbers that have held up fairly well despite being pressured by broad economic conditions this year. The stock has also performed well since its bear market low in March, but dropped -19% below its last peak at the beginning of January. The pullback could offer a good technical opportunity to buy into a solid long-term trend; Is the stock also a good value, or has the trend pushed the stock’s price past reasonable valuation levels? Let’s find out.
Fundamental and Value Profile
Steel Dynamics, Inc. is a steel producing and a metal recycling company. The Company is engaged in the manufacture and sale of steel products, processing and sale of recycled ferrous and nonferrous metals, and fabrication and sale of steel joists and deck products. Its segments include steel operations, metals recycling operations, steel fabrication operations and Other Operations. It offers a range of steel products, such as sheet products, long products and steel finishing. The steel operations segment includes Butler Flat Roll Division, Columbus Flat Roll Division, The Techs galvanizing lines, Structural and Rail Division, Engineered Bar Products Division, Roanoke Bar Division, Steel of West Virginia and Iron Dynamics. The metals recycling operations segment consists of OmniSource Corporation. The fabrication operations produce steel building components. The Other Operations segment consists of subsidiary operations and smaller joint ventures. STLD has a current market cap of $7.2 billion.
Earnings and Sales Growth: Over the past year, earnings increased nearly 56.5%, while sales improved by about 9.75%. In the last quarter, earnings grew by 90%, while sales increased 11.6%. STLD operates with a modest margin profile that has been strengthening, which is a bit surprising considering broad pressures throughout most of 2020; over the last twelve months, Net Income was 5.74% of Revenues, and increased to 7.22% in the last quarter.
Free Cash Flow: STLD’s Free Cash Flow is modest, but declining, at roughly $123 million, and which translates to a Free Cash Flow Yield of 1.71%. That marks a decline from around $811 million at the beginning of 2020 and $710.92 million in the middle of last year. The decline isn’t unexpected given broad economic conditions this year, but the concern is the way the decline has accelerated in the half of the year. This is a sign that profitability is also eroding, which makes this an element that bears watching in the quarters ahead.
Debt to Equity: STLD has a debt/equity ratio of .72, which is reflects a conservative approach to leverage. The company’s balance sheet shows cash and liquid assets of about $1.38 billion in the last quarter versus long-term debt of $3 billion. STLD’s operating profile indicates there should be no problem servicing their debt, but the decline in Free Cash Flow continues to narrow the company’s flexibility, which can only continue for so long.
Dividend: STLD pays an annual dividend of $1.00 per share, which at its current price translates to a dividend yield of about 2.92%. It is also worth noting that management has raised the dividend when many others are cutting or eliminating theirs; at the beginning of 2020, the dividend was $.96 per share, per annum.
Price/Book Ratio: there are a lot of ways to measure how much a stock should be worth; but I like to work with a combination of Price/Book and Price/Cash Flow analysis. Together, these measurements provide a long-term, fair value target around $39 per share. That means that STLD is modestly undervalued, with about 14% upside from its current price. It is also worth mentioning that this measurement provided a fair value target in the last quarter of 2020 at $36; the increase is a positive sign of strength.
Technical Profile
Here’s a look at the stock’s latest technical chart.
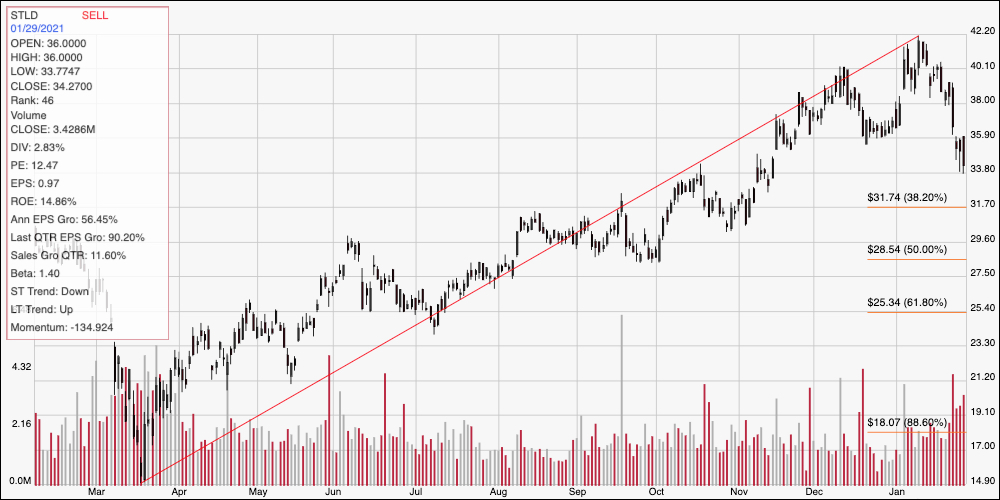
Current Price Action/Trends and Pivots: The diagonal red line marks the stock’s upward trend from March 2020 to the beginning of this year. It also provides the baseline for the Fibonacci retracement lines on the right side of the chart. From that peak, the stock has dropped back sharply, most recently falling below important trend support at around $36 per share. That means immediate resistance is at prior resistance at $36, with current support somewhere between $34 based on pivot activity in October, and $32 where the 38.2% retracement line sits. A pivot anywhere between $34 and $32 has near-term upside to $36, and then to about $40 after that, provided bullish momentum begins to accelerate. A drop below $32, however, has additional downside to about $28.50 to next support, inline with the 50% retracement line.
Near-term Keys: The stock’s drop off its 52-week high at around $42 could offer some useful short-term trading opportunities depending on which direction the stock moves in the near term. A push above $36 could be a good signal to consider buying the stock or working with call options, using $40 as a good, short-term bullish profit target. A drop below $34, on the other hand, could be a good opportunity to think about shorting the stock or buying put options, with $32 acting as a good initial profit target and $28.50 reachable beyond that point. What about value? The company has some useful fundamental strengths behind it, but declining Free Cash Flow is a concern that doesn’t make the stock’s modest value proposition more compelling. I would wait to see Free Cash Flow arrest its year-long decline before looking for a new, long-term investment in this stock.