Over the last several years, one of the biggest benchmarks the Fed has used to evaluate the need to raise, lower or maintain their interest rate policy has been the employment rate. Every month, the market seems to hold its breath as a new set of unemployment and salary data is made available and everybody gets to wonder what the information means for the current economic climate and, therefore, for interest rates. The most recent monthly report, which showed unemployment increasing more than expected, has increased the push in Washington for even more federal stimulus, including direct payments and continued extensions on extra unemployment payments.
ManpowerGroup Inc. (MAN) is one of the largest providers of workforce solutions and services, with operations that span the globe. Throughout the pandemic, the most dramatically affected industries have been those that rely the most on face-to-face interactions, such as restaurants, theaters, and so on. On the other hand, the pandemic has also forced much of corporate America to shift to a work-at-home model, which has managed to keep employment numbers for highly skilled technical and professional occupations relatively healthy. These patterns have shown to be true so far even as vaccinations are gradually starting to increase, and additional vaccine candidates are expected to be approved in the coming weeks to increase vaccine supply even more. The idea of a recovery on the horizon for social activities and the businesses that support them lends strength to the idea that demand for staffing services such as those provided by MAN could also increase.
In the most generalized sense, economic downturns tend to be strongly negative for a company like MAN, and this is a company that bears its share of COVID-driven scars; but interestingly enough, the stock has performed very well since following the rest of the market to a bear market low a year ago at around $49.50, having hit a 52-week high at the beginning of January at around $98 before falling back to a low at the start of February at around $86.50. The stock is picking up bullish momentum again, which begs an important question for fundamental and value-oriented investors: how much upside is left? Let’s find out.
Fundamental and Value Profile
ManpowerGroup Inc. is a provider of workforce solutions and services. The Company’s segments include Americas, Southern Europe, Northern Europe, Asia Pacific Middle East (APME), Right Management and Corporate. The Company’s Americas segment includes operations in the United States and Other Americas. Its Southern Europe segment includes operations in France, Italy and Other Southern Europe. Its Northern Europe segment includes operations in the United Kingdom, the Nordics, Germany and the Netherlands. The Company’s APME operations provide a range of workforce solutions and services offered through Manpower, Experis and ManpowerGroup Solutions, including permanent, temporary and contract recruitment, assessment and selection, training and outsourcing. The Company’s Right Management segment provides talent and career management workforce solutions. The Company provides services under its Experis brand, particularly in the areas of information technology (IT), engineering and finance. MAN’s current market cap is $5.4 billion.
Earnings and Sales Growth: Over the last twelve months, earnings declined by almost -31% while revenues declined by about -2.73%. In the last quarter, earnings improved by a little over 23%%, while sales increased 10.25%. MAN operates with a very narrow margin profile that has narrowed during the pandemic to nearly zero; over the last twelve months, Net Income was 0.13% of Revenues, but increased somewhat to 1.51% in the last quarter. Is this an indication, along with last quarters attractive EPS growth, that the company is turning a corner to sustained growth? Perhaps; I’m more inclined, however to say that this is a number that is encouraging, but bears continued attention in the quarters ahead.
Free Cash Flow: MAN’s free cash flow is healthy, at about $885 million. This is a number that is a bit higher from a year ago, when Free Cash Flow was a more conservative, but growing $838 million (well above the year prior to that). This is a good sign the company’s overall profitability has actually remained relatively stable during the past year and also provides an interesting counterpoint to the less-certain Net Income picture I just described. It also translates to a very healthy Free Cash Flow yield of 16.46%.
Debt to Equity: MAN has a debt/equity ratio of .45. This is a conservative number that is manageable despite its increase over the last year or so from .17. The company’s balance sheet indicates that despite its razor-thin margin profile, it is sufficient to service its conservative level of debt, with healthy liquidity from about $1.5 billion in cash (a number that actually improved from the beginning of 2020, at $1.1 billion) and liquid assets to provide additional flexibility against $1.1 billion in long-term debt (down from mid-2020 at about $1.3 billion).
Dividend: MAN pays an annual dividend of $2.34 per share, which translates to a yield of about 2.5% at the stock’s current price. MAN/s dividend has also grown consistently, from $2.02 per share it paid in mid-2019 to $2.18 last year, and provides additional evidence of healthy underlying fundamental strength.
Price/Book Ratio: there are a lot of ways to measure how much a stock should be worth; but I like to work with a combination of Price/Book and Price/Cash Flow analysis. Together, these measurements provide a long-term, fair value target at about $115 per share. That means that even with the stock’s increase in the last eleven months, the stock is trading at a useful discount, with about 24% upside from the stock’s current price.
Technical Profile
Here’s a look at the stock’s latest technical chart.
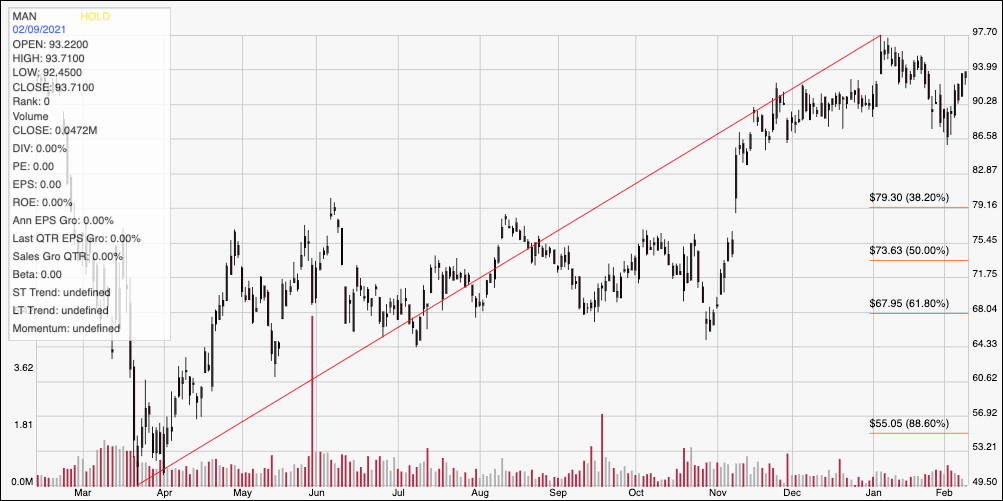
Current Price Action/Trends and Pivots: The red diagonal line measures the length of the stock’s upward trend from its March low at around $49.50 to its peak at the beginning of 2021 at around $98; it also informs the Fibonacci trend retracement lines shown on the right side of the chart. The stock dropped off of that $98 high through January to find support at around $86.50, but has picked up bullish momentum since, breaking first resistance in the last couple of days at around $90 per share. That means immediate resistance should be near the stock’s $98 high, about $4 away from its current price, with previous resistance at $90 becoming new support. If momentum reverses and pushes the stock below $90, it should find next support around the January low at $86.50.
Near-term Keys: If you’re looking for a short-term bullish trade, MAN could be offering an interesting signal right to think about buying the stock or working with call options, with an eye on the stock’s recent peak around $98 as a good short-term target price. If momentum reverses and pushes the stock below $90, you could also consider shorting the stock or buying put options, with $86.50 providing a functional, quick-hit profit target on a bearish trade. The value proposition is interesting at the stock’s current price, with momentum working in its favor. The market’s apparent expectation for additional stimulus from Washington, if validated, would also likely provide an additional headwind for the stock’s long-term upward to extend even further. Despite those positives, a conservative-minded investor should continue to keep an eye on the company’s Revenue and Net Income numbers in the quarters ahead, as those will likely be the earliest and best confirmation of the strength currently demonstrated.