There are a lot of ways to look at a company and evaluate them for fundamental strength. Traditional metrics, including many of the ones that I rely on for the stocks that I analyze, measure everything from sales and earnings growth to how much productivity the company realizes per employee. You can break down the type of debt a company carries, how much of their available cash reserves can be accessed the most quickly, what percentage of earnings is paid out to shareholders in the form of dividend and/or stock buybacks, and so on. The types of fundamentals tools you can tap into are nearly as abundant as the types of technical indicators you can use to measure a stock’s price.
Part of the purpose for conducting a thorough fundamental analysis is to estimate how much risk you might be taking when you invest your hard-earned dollars into a stock. The microeconomic view, which focuses mostly on the company itself, includes where the company does business, how localized or global their operations are. These kinds of questions help to identify whether you’re working with a relatively small business or a major player in a respective industry. Generally, the broader the scope a company’s business operations is, the less risky it should be, since when operations in one region might ebb, they may flow in another one. It’s also useful to consider the macroeconomic perspective, which extends further to include industry and sector dynamics as well as national and global economic conditions such as interest rates, job and manufacturing growth, and consumer confidence, as well as political questions like taxation and global trade relationships.
Caterpillar Inc. (CAT) is a good example. CAT isn’t just one of the most recognizable U.S. companies in the entire stock market; of stocks in the Industrial sector, they are probably the most widely known, since their heavy equipment is seen in construction and mining settings all over the world. That is almost always seen as a strength, but the last couple of years have introduced an increasing number of risk elements. 2018 and 2019 were largely dominated by global trade tensions between the U.S. and its most important trading partners amid a glowing global economy. For the last year, the coronavirus pandemic has continued to weigh against worldwide growth; even as new vaccines are being approved and administered, few economists expect pandemic-driven pressures to abate before the latter part of this year.
The irony of the past year is that despite those clear pressures, CAT’s stock price has more than doubled from its March 2020, pandemic-driven, bear market low at around $87.50. As of the close of trading last Friday, the stock was pressing close to $200 per share, having followed a clear, sustained upward trend throughout the past year that has only just begun to flatten this year. There is some justification for that strong move, as the company has managed to increase the strength of its balance sheet, including strengthening its access to liquid assets and a sizable improvement in its Book Value per share; however when considered against other fundamental metrics that include weakening Net Income and reduced Free Cash Flow, it should be natural to wonder whether the stock’s current prices are justified. Let’s dig in to see if we can identify a reasonable value price.
Fundamental and Value Profile
Caterpillar Inc. is a manufacturer of construction and mining equipment, diesel and natural gas engines, industrial gas turbines and diesel-electric locomotives. The Company operates through segments, including Construction Industries, which is engaged in supporting customers using machinery in infrastructure, forestry and building construction; Resource Industries, which is engaged in supporting customers using machinery in mining, quarry, waste and material handling applications; Energy & Transportation, which supports customers in oil and gas, power generation, marine, rail and industrial applications, including Cat machines; Financial Products segment, which provides financing and related services, and All Other operating segments, which includes activities, such as product management and development, and manufacturing of filters and fluids, undercarriage, tires and rims, ground engaging tools, fluid transfer products, and sealing and connecting components for Cat products. CAT’s current market cap is $107.6 billion.
Earnings and Sales Growth: Over the last twelve months, earnings declined by -19.4%, while sales were -14.5% lower. In the last quarter, earnings improved by a little over 58%, while sales grew by 13.7%. CAT’s operating profile generally saw Net Income as a percentage of Revenues nicely above 10% on a consistent basis prior to 2020; however the past year has seen that profile deteriorate over the last twelve months, as Net Income was 7.18% of Revenues, and declined somewhat to 6.94% in the last quarter.
Free Cash Flow: CAT’s free cash flow is generally healthy at about $4.98 billion for the last twelve months, however this number has decreased over the past year, from about $5.4 billion at the beginning of 2020, and translates to a Free Cash Flow Yield of 4.63%.
Debt to Equity: CAT has a debt/equity ratio of 1.69. This number is higher than I generally prefer to see, but isn’t unusual for Industrial stocks. The company’s balance sheet shows that operating profits are more than adequate to service their debt; in addition, CAT has healthy liquidity with cash and liquid assets in the last quarter of a little over $9.3 billion against long-term debt of about $26 billion.
Dividend: CAT pays an annual dividend of $4.12 per share, which translates to a yield of 2.08% at the stock’s current price.
Price/Book Ratio: there are a lot of ways to measure how much a stock should be worth; but I like to worth with a combination of Price/Book and Price/Cash Flow analysis. Together, these measurements provide a long-term target at about $40 per share. That suggests CAT is significantly overvalued right now, by about -39%, with a useful discount price at around $120.50 per share.
Technical Profile
Here’s a look at the stock’s latest technical chart.
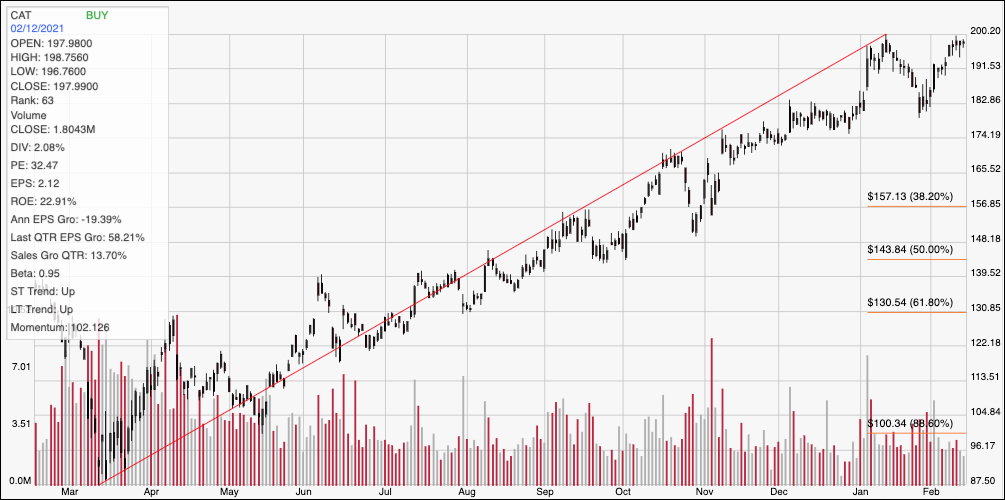
Current Price Action/Trends and Pivots: The chart above outlines the stock’s movement over the past year. The red diagonal line traces the stock’s long-term upward trend from its bear market low at around $87.50 to its high in January at around $200 per share; it also provides the baseline for the Fibonacci retracement lines shown on the right side of the chart. After hitting that high, the stock fell back to near-term support at around $182 at the end of January before rebounding again; the stock’s bullish momentum from that point has it currently sitting just a little below that $200 high. Given the $18 distance between the last resistance break in January to that high at around $200, a new push above $200 could see short-term upside to about $218; however a pivot off of that resistance level has about the same amount of downside to about $182 per share, with additional downside to next support sitting at around $174 if bearish momentum accelerates.
Near-term Keys: Trying to find a short-term bullish trade with CAT is pretty speculative right now, and should only be taken if the stock breaks above $200 with additional indicators such as increasing buying volume to go along with it. That could be a useful signal, however to buy the stock or work with call options, with upside to about $218. A pivot off of resistance at $200, however would be a good signal to think about shorting the stock or buying put options, using $182 as an attractive target on a bearish trade. The stock is far too overvalued to take seriously as a long-term bargain, and I think there is a strong argument to be made against the stock as a useful long-term growth play as well considering the current pattern of fading Free Cash Flow and Net Income growth. These metrics would need to swing back into a positive correlation in order to prompt me to believe otherwise.