Ever since coronavirus found its way to American shores, a lot of media attention has been given to the Healthcare sector – and especially to the Biotechnology industry, where many of the biggest names across the world have been working hard to develop effective treatments for the disease. From the market’s bearish low in mid-March, the Biotech industry rebounded strongly, increasing in value by more than 50% by mid-July, as measured by the iShares NASDAQ Biotechnology ETF (IBB). The industry retraced from that point until late September – a drop that I think can be attributed both to simple profit-taking in many of the names that drove the increase, and to the frank reality that even with emergency use approvals and fast-tracked regulatory processes, COVID treatments – whether antiviral or straight vaccine – would not be likely to be available for widespread distribution and use until sometime this year.
From that point, however, the industry has rebounded nicely, driven by progress on the vaccine front that saw approval of the third vaccine candidate over this last weekend, and increased production of the previous two already approved vaccines. That gave the industry a new sense of optimism that the end of the pandemic is in sight. It is still true that in the broadest sense, full herd immunity via vaccination isn’t likely to be reached until the middle of the year, but even as the total number of vaccines administered rises, infection rates along with hospitalizations have also been dropping, which are both encouraging signs.
Some of the names that showed early promise also received the most attention from analysts and media types, at least in the earliest stages of the pandemic. One of those companies is Gilead Sciences Inc. (GILD), a large-cap company with treatments for diseases such as HIV/AIDS, cancer, and other respiratory diseases. One of their antiviral drugs, remdesivir was originally created to combat the hepatitis C virus, but that demonstrated a benefit in clinical trials with hospitalized COVID patients – enough to gain emergency approval from the FDA. Outside of COVID-19, the company has been investing heavily since 2019 to bolster its drug pipeline, with its acquisition of Immunomedics providing a newly approved treatment for metastatic triple-negative breast cancer that is expected to generate $3.5 billion in sales by 2025. The caveat associated with remdesivir as a growth driver is that its long-term benefit is less clear; in the absence of useful vaccines and antivirals specifically created for COVID in 2020, physicians were forced to be creative, creating cocktails of existing drugs in an attempt to treat symptoms and to help patients get through the worst effects.
Some of the early news about remdesivir gave investors enough enthusiasm about GILD to push the stock from a February low around $62 to a May peak at around $86. From that point, however, the company’s latest earnings reports have shown that, while the company has a healthy balance sheet, their capital expenditures – which certainly, and appropriately included a big push to fast-track remdesivir as a COVID treatment – put the company’s operating profile in net-negative territory. That was a strong enough concern to push the stock back down to its pre-pandemic lows in early October and again in December of last year. At the beginning of 2021, the stock stage a sizable push from that low, at around $56.50 to a February high at around $68, only to fade back since then to its current price at around $62.50. Is the picture as bad as it looks, or could the stock’s fade offer a useful opportunity for long-term, value-based investors? Let’s take a look.
Fundamental and Value Profile
Gilead Sciences, Inc. is a research-based biopharmaceutical company that discovers, develops and commercializes medicines in areas of unmet medical need. The Company’s portfolio of products and pipeline of investigational drugs includes treatments for Human Immunodeficiency Virus/Acquired Immune Deficiency Syndrome (HIV/AIDS), liver diseases, cancer, inflammatory and respiratory diseases and cardiovascular conditions. Its products for HIV/AIDS patients include Descovy, Odefsey, Genvoya, Stribild, Complera/Eviplera, Truvada, Emtriva, Tybost and Vitekta. Its products for patients with liver diseases include Vemlidy, Epclusa, Harvoni, Sovaldi, Viread and Hepsera. It offers Zydelig to patients with hematology/oncology diseases. Its products for patients with various cardiovascular diseases include Letairis, Ranexa and Lexiscan. Its products for various inflammation/respiratory diseases include Cayston and Tamiflu. It had operations in more than 30 countries, as of December 31, 2016. GILD has a current market cap of $78.7 billion.
Earnings and Sales Growth: Over the past year, earnings increased more than 99%, while sales grew by a little over 26%. In the last quarter, earnings were 3.79% higher, while sales increased by nearly 13%. In the quarter prior, GILD’s operating profile dipped into negative territory, but appears to have stabilized as of the most recent report; Net Income as a percentage of Revenues was 0.50% in the trailing twelve-month period and strengthened to 20.9% in the last quarter.
Free Cash Flow: GILD’s Free Cash Flow is generally healthy, at about $7.5 billion. On a Free Cash Flow Yield basis, that translates to 9.52%. It should be noted that this number has declined steadily since the beginning of 2016, when Free Cash Flow peaked at $19.5 billion, but has also improved from late 2019, when Free Cash Flow was about $6.6 billion. It is also somewhat lower versus the last quarter at $8.1 billion.
Debt to Equity: GILD has a debt/equity ratio of 1.85, which is a bit higher than I prefer to see, and also reflects increasing debt the company has taken on, in part to complete its acquisition of Immunomedics; but by itself this number doesn’t really tell the whole story. Their balance sheet shows $7.4 billion in cash in the last quarter (down from $$23.9 billion the last quarter) against $33.77 billion (up from $28.8 billion) in long-term debt. The company’s operating profile suggests there should be no problem servicing debt payments, but the large decline in cash, along with deteriorating Free Cash Flow while debt is increasing is a red flag that bears watching for improvement in the quarters ahead.
Dividend: GILD pays a dividend of $2.84 per share (up from $2.52 in 2019 and $2.72 last year), which translates to an annual yield of about 4.51% at the stock’s current price. Management’s ability to increase the dividend is generally a positive sign.
Price/Book Ratio: there are a lot of ways to measure how much a stock should be worth; but I like to work with a combination of Price/Book and Price/Cash Flow analysis. Together, these measurements provide a long-term, fair value target around $54 per share, which means that GILD is overvalued, with about -14% downside from its current price, and also puts the stock’s bargain price at around $43.
Technical Profile
Here’s a look at the stock’s latest technical chart.
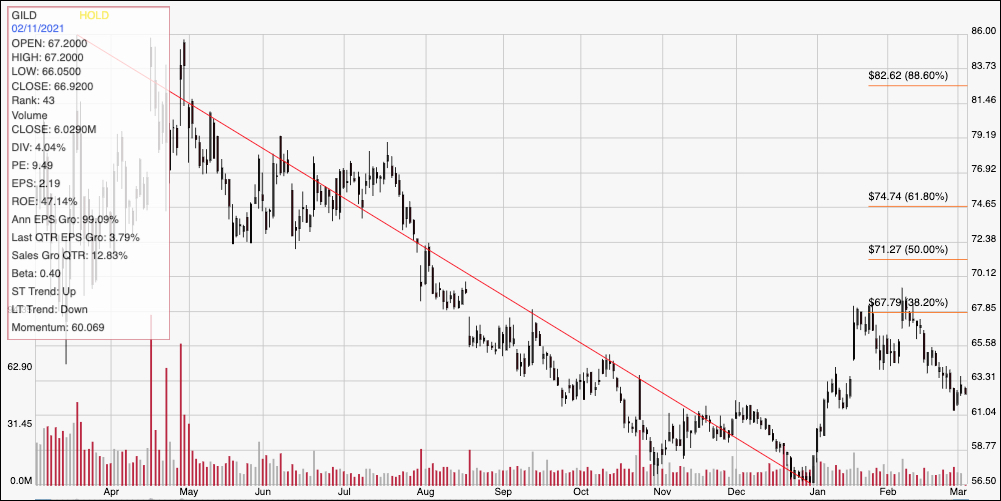
Current Price Action/Trends and Pivots: the chart above covers the last year of price activity for GILD. The diagonal red line traces the stock’s downward trend from its March high at around $86 to its December low a little at around $56.50 per share; it also provides the baseline for the Fibonacci retracement lines shown on the right side of the chart. GILD rebounded from that low to peak at around $68 in January, and then again in February, but has faded back from that point in the last month. Immediate support should lie at around $61 based on pivot activity in early December as well as the last week, with next support at $56.50. A push above immediate resistance at $63.50 has upside to about $65.50, with room to test the February peak around $68 if bullish momentum accelerates.
Near-term Keys: Given GILD’s overvalued status in spite of the stock’s sharp decline since May, it’s hard to get too excited about seeing the stock trading at a steep discount relative to its 2020 highs. The company would need to post measurable improvements in Free Cash Flow, with continued improvement in Net Income in the quarters ahead to begin to shift the fundamental view of this company in a more favorable light. That also means that the best probabilities lie with short-term trades. If the stock can break above $63.50, you could consider buying the stock or working with call options, using $65.50 as practical, bullish profit target; a drop below $61 could provide a signal to think about shorting the stock, using $57 as a useful target on a bearish short-term trade.