One of the things that I like to do as an economist is to look for emerging trends and markets. For some, an emerging market means looking outside the borders of the U.S. or other, established market economies to areas of the world showing dramatic progress in terms of economic or political progress. For me, those kinds of emerging markets are hard to analyze, simply because the same kinds of analytical data generally isn’t readily available to the average retail investor. That means that it’s actually easier to try to think about nascent, emerging technologies or opportunities within existing segments of U.S. and global economy.
One of the areas that I think will offer the best opportunities in the next several years is in the telecommunications industry. That’s the long-anticipated, and still emerging buildout of 5G infrastructure, which not only enables greater web-enabled functionality for consumers, but is also going to be the the core infrastructure linchpin for Internet of Things (IoT) devices and communications in virtually every other sector of the economy. Qualcomm Inc. (QCOM) has long been one of the biggest investors in 5G technology, with thousands of patents already in place that make up the biggest portion of their business model.
The irony of calling QCOM an “emerging” opportunity is that, since the market bottomed in March 2020, the stock nearly tripled in price, going from about $58 at that low point to a peak at the beginning of February – just about a month ago – at around $168. A lot of that increase can be attributed to the recognition by investors and analysts alike about QCOM’s place in useful technologies including cloud computing, remote networking, and even teleconferencing that became so important to keeping so much of corporate America running throughout the COVID-19 pandemic. The increase in price makes it hard for contrarian, value-based investors like myself to immediately call QCOM a value, and that is still true even though the stock has actually dropped from that $168 by about -24% in the last month.
The limitation of a strictly contrarian approach to value analysis, however is that it tends to de-emphasize the potential opportunity that lies ahead of a company that could be well-positioned for next-generation types of advances in its sector or industry. QCOM’s massive investments in 5G and other related technologies, however make a case for a rare exception to that traditional valuation model. One of the ways to counter that limitation is using a stock’s PEG ratio, which means the stock’s price against anticipated future earnings growth. Using that metric, QCOM looks like the stock’s current drop could translate to an outstanding opportunity for a patient, long-term oriented investor.
Fundamental and Value Profile
QUALCOMM Incorporated is engaged in the development and commercialization of a digital communication technology called code division multiple access (CDMA). The Company is engaged in the development and commercialization of the orthogonal frequency division multiple access (OFDMA) family of technologies, including long-term evolution (LTE), which is an Orthogonal Frequency Division Multiplexing (OFDM)-based standard that uses OFDMA and single-carrier Frequency Division Multiple Access (FDMA), for cellular wireless communication applications. The Company’s segments include QCT (Qualcomm CDMA Technologies), QTL (Qualcomm Technology Licensing) and QSI (Qualcomm Strategic Initiatives). The Company also develops and commercializes a range of other technologies used in handsets and tablets that contribute to end user demand. The Company’s products principally consist of integrated circuits (chips or chipsets) and system software used in mobile devices and in wireless networks. QCOM has a current market cap of about $145.2 billion.
Earnings and Sales Growth: Over the last twelve months, earnings grew more than 146%, while revenues increased by about 62.2%. The In the last quarter, earnings increased by about 60%, while sales decreased by -1.33%. The company’s margin profile is healthy, and getting stronger; Net Income as a percentage of Revenues was a robust 25% over the last twelve months and almost 30% in the last quarter.
Free Cash Flow: QCOM’s free cash flow is healthy and growing, at $8.9 billion over the last twelve months. This number translates to a Free Cash Flow Yield of about 6.12%. The twelve-month number also marks an increase from the beginning of 2020, when Free Cash Flow was $7 billion.
Debt to Equity: QCOM’s debt/equity ratio is very high, at 2.06. The company’s balance sheet shows that they have about $12.3 billion in cash and liquid assets against $15.2 billion in long-term debt. That means that the company has plenty of liquidity to work with, with generally healthy operating profits as well.
Dividend: QCOM’s annual dividend is $2.60 per share, which translates to a yield of 2.03% at the stock’s current price.
Price/Book Ratio: there are a lot of ways to measure how much a stock should be worth; but I like to work with a combination of Price/Book and Price/Cash Flow analysis. Together, these measurements provide a long-term, fair value target just little under $104 per share. That suggests the stock is trading at a premium of about -19%, with a traditional “bargain price” at around $83. That doesn’t sound attractive, but it also illustrates the limitation of a traditional value-based approach, since it relies primarily on current to historical comparisons. If you factor in the stock’s PEG ratio on the same basis, which does include expected earnings growth in the next year, the long-term “fair value” target actually increases to a little over $206 per share, which signals that even with its rise from bear market levels to today, the stock still has more than 61% of opportunity from its current price.
Technical Profile
Here’s a look at the stock’s latest technical chart.
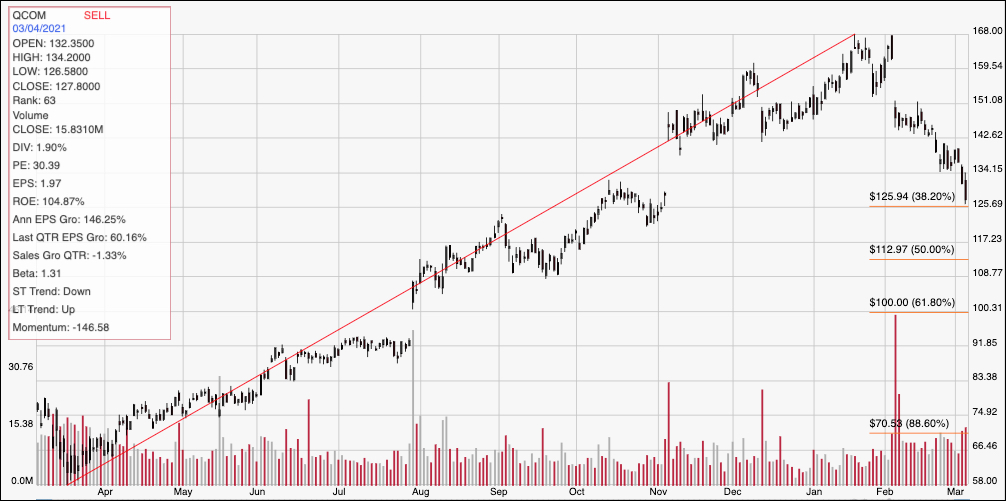
Current Price Action/Trends and Pivots: The chart above displays the stock’s upward trend from its bear market low at around $58 to its current price a little below $128. The red diagonal line traces the upward trend from $58 to its February peak at around $168; it also provides the baseline for the Fibonacci retracement lines shown on the right side of the chart. The stock has moved into a short-term downward trend that has pushed the stock near to the 38.2% retracement line, which should act as solid support against the current downward trend and give the long-term bullish trend an opportunity to reassert itself. Current resistance is at around $142.50, based on pivot low activity in that price area in November and December of last year. If the stock drops below support at $126, it could drop to around $120 before finding next support, based on pivot activity in late October and early September, with the 50% retracement line waiting around $113 if bearish momentum accelerates. A bounce off of expected support around $126, however has more than $16 of short-term upside to about $142.50.
Near-term Keys: QCOM’s traditional valuation metrics mean that, despite the general fundamental strength the company is showing right now, I can’t call QCOM a typical, useful value play. The problem with that traditional view is that it excludes the long-term opportunity in next-generation technology that is going to underpin just about every type of electronic, web-based transaction or interaction you can think of or anticipate right now. I generally don’t like to make exceptions to my valuation model, but I do think that 5G is one rare example that does justify it. On that basis, QCOM still looks like an amazing opportunity in the long term. If you prefer short-term, directional based trades, the stock’s current price action could also provide useful swing or momentum-based trading opportunities. Use a bounce off of current support at around $126 as a signal to buy the stock or work with call options, with a near-term peak at around $142.50. A drop below $126, on the other hand could offer an interesting signal to short the stock or work with put options, with a near-term price target around $120 per share, or $113 if bearish momentum accelerates.