No matter what the current economic climate is, one of the many questions active investors have to try to answer is what sectors and industries in the market provide the best opportunities. Some industries tend to be cyclical in nature, meaning that their profitability is positively correlated to the ebb and flow of the broad economy, while others tend to be less susceptible to those influences. Those are defensive industries, and when economic conditions are uncertain, or slowing, defensive industries are usually more attractive than cyclicals.
For the stock market, the last year has marked a bit of divergence from that traditional model I just described, as investors have been anxious to look past the “pandemic effect” that forced many industries into clear recessionary conditions, and unemployment to spike to historically high levels not seen in decades. That has pushed a lot of industries higher over the past year, to levels that a value-oriented analyst like myself can only consider as being overpriced. In cyclical industries like Transportation, those prices controvert the reality of the past year’s financial and economic pressures, making the investing decision harder.
Most current economic reports are starting to point to signs of increasing economic health in conjunction with positive health trends like accelerating vaccinations and declining COVID infection rates and hospitalizations. That data leads me to believe that investors analysts who started buying stocks last year at the bottom of the pandemic may have been jumping the gun a bit, but that they may also simply have been on the very early side of the cyclical curve back to growth. It doesn’t change the valuation argument, or the discipline that is required to filter for stocks that offer useful discounts, but it also suggests that if you can find stocks that still offer reasonable valuations, there are still good opportunities to be had.
Schneider National, Inc. (SNDR) is an interesting stock in the Transportation industry. This is a small-cap company with a focus on the various operations that are specific to trucking services. While railroad transportation for goods across the country is often considered more affordable, it also usually takes longer, which is why rail transportation tends to most often be tied to bulk cargo, hazardous materials, and so on. Trucking supports rail transportation by offloading from a railyard and transporting to a final destination, while also offering a faster cross-country alternative in many cases for loads like consumer goods. Schneider’s balance sheet indicates that it has seen an impact over the past year from pandemic-driven pressures, but also that has remained resilient throughout. That includes consistent Free Cash Flow, improving net margins, and excellent liquidity. After surging in February to a recent high at around $26, however the stock has fallen back a bit to around $24. Does that price mark a good value to go along with the company’s solid fundamental profile? Let’s find out.
Fundamental and Value Profile
Schneider National, Inc. is a provider of transportation, logistics and related services. The Company’s transportation solutions include one-way, intermodal, dedicated, bulk, transport management, trans loading services, international services and Schneider payment services. Its supply chain management and consulting services include logistics solution design, global supply chain services, enterprise and market entry assistance, and sourcing and compliance. Schneider Logistics is the subsidiary of the Company, which provides supply chain management technology, managed services, engineering services and freight payment. The Company operates approximately 10,000 tractors, around 28,800 trailers and around 14,300 containers. It has operations in around 36 locations in Canada, the United States and Mexico. SNDR has a current market cap of $4.3 billion.
Earnings and Sales Growth: Over the last twelve months, earnings improved by nearly 19%, while sales grew by 9.4%. In the last quarter, earnings increased almost 42% while Revenues improved 11.4%. SNDR’s Net Income versus Revenue over the last year was 4.65%, but improved in the last quarter to 6.08%.
Free Cash Flow: On a trailing twelve-month basis, SNDR’s Free Cash Flow was a little over $286 million in the last quarter. That is below the $456 million level registered in the quarter prior, but is also a bit above its a mark from the beginning of 2020 at $260 million. The current number translates to a Free Cash Flow Yield of 6.53%.
Debt to Equity: SNDR has a debt/equity ratio of .13, which is very conservative. Their balance sheet shows a little over $442.6 million in cash and liquid assets against $266.4 million in long-term debt. Their operating profile is more than adequate to service their debt, with plenty of liquidity from cash and liquid assets to provide additional flexibility.
Dividend: SNDR pays an annual dividend of $.28 per share, which at its current price translates to a modest yield of 1.14%.
Price/Book Ratio: there are a lot of ways to measure how much a stock should be worth; but I like to work with a combination of Price/Book and Price/Cash Flow analysis. Together, these measurements provide a long-term, fair value target around $28 per share. That suggests that SNDR is modestly undervalued, with about 15% upside from its current price.
Technical Profile
Here’s a look at the stock’s latest technical chart.
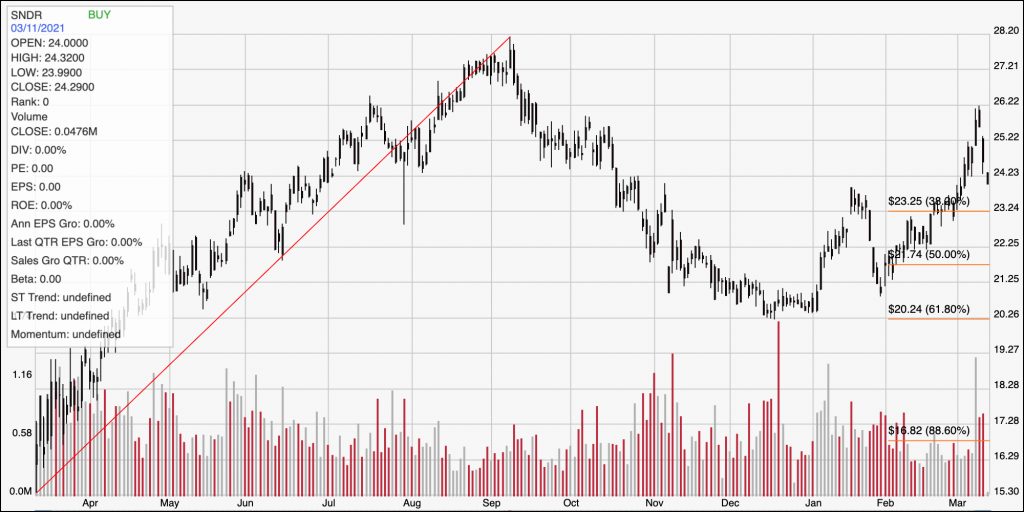
Current Price Action/Trends and Pivots: The red diagonal line defines the stock’s upward trend from its bear market low in March of last year to its 52-week high in September a little above $28 per share. It also provides the baseline for the Fibonacci retracement lines on the right side of the chart. The stock dropped back from that peak to a January low at around $20 where the 61.8% retracement line sits. After a temporary rally to the 38.2% retracement line, the stock tested that $20 support again at the end of January before starting a new, short-term upward trend that only recently peaked a few days ago at around $26, marking the stock’s most immediate resistance. The stock is also now approaching support, which could lie anywhere between $24 and $23, inline with the 38.2% retracement line. A drop below support should find next support at around $22 based on the 50% retracement line, while a push above $26 would give the stock upside to retest its 52-week high around $28.
Near-term Keys: SNDR’s balance sheet has remained solid through the past year, which also bolsters their value proposition. That could make SNDR an interesting stock to keep track of throughout the year as a potential long-term opportunity. If you prefer to work with short-term strategies, you could use a pivot off of support anywhere between $24 and $23 as a signal to buy the stock or work with call options, using $26 as a good initial profit target and $28 if bullish momentum increases. A drop below $24 could offer a signal to consider shorting the stock or buying put options, with $22 providing a first profit target and $20 below that point.