Intel Corp (INTC) is a stock that I’ve followed for quite some time, and that I’ve written about in this space quite a bit over the past year. This is one of the 600-lb gorillas of the Technology sector, after all, and the company that is easily considered the gold standard of companies in the Semiconductor industry. That said, the stock mostly underperformed the rest of the Tech sector as well as the Semiconductor industry in 2020, as analysts and investors shared concerns about lost market share in the CPU space, especially in servers, to AMD along with increasing uncertainty about the path ahead for INTC’s 7nm production.
Despite a strong fundamental profile that included a healthy balance sheet, increasing Free Cash Flow, and strong liquidity throughout the past year, those issues were apparently enough to prompt a change in executive leadership, with Pat Gelsinger, a long-time Intel employee before leaving in 2009 to lead VMWare, taking over for Bob Swan. Since that change in leadership was announced, the stock has surged, pushing from a January starting point at around $50 to its current level at around $63.
The company’s latest earnings report shows that the fundamental strengths I just outlined still exist, with the market also seeming to buy into Mr. Gelsinger’s deliberate method to unraveling 7 nm production problems. Another positive note came from the pending sale of INTC’s NAND storage unit to South Korea tech company SK Hynix for $9 billion. The deal, which had already been approved by the FTC cleared its final, international regulatory hurdle last week. Questions remain, of course about how quickly enterprise spending on IT infrastructure will rebound as the year progresses; this is a side of INTC’s business that held progress back in 2020 as businesses were forced to shift to work from home models that de-emphasized spending on traditional IT purchases. AMD’s capture of a big piece of that market at INTC’s expense has also shown an impact as well. The real question at this point is whether the company’s underlying fundamental strength, and new management’s efforts to infuse INTC’s historical emphasis on innovation and internal production efficiency still combine to give value investors a reason to stay bullish about the stock’s long-term prospects. Let’s dive in.
Fundamental and Value Profile
Intel Corporation is engaged in designing and manufacturing products and technologies, such as the cloud. The Company’s segments are Client Computing Group (CCG), Data Center Group (DCG), Internet of Things Group (IOTG), Non-Volatile Memory Solutions Group (NSG), Intel Security Group (ISecG), Programmable Solutions Group (PSG), All Other and New Technology Group (NTG). It delivers computer, networking and communications platforms to a set of customers, including original equipment manufacturers (OEMs), original design manufacturers (ODMs), cloud and communications service providers, as well as industrial, communications and automotive equipment manufacturers. It offers platforms to integrate various components and technologies, including a microprocessor and chipset, a stand-alone System-on-Chip (SoC), or a multichip package. The CCG operating segment includes platforms that integrates in notebook, two in one systems, desktop computers for consumers and businesses, tablets, and phones. INTC’s current market cap is about $255.1 billion.
Earnings and Sales Growth: Over the last twelve months, earnings were flat – exactly 0% while sales slipped by about -1.14%. In the last quarter, earnings increased nearly 37%, while sales were almost 9% higher. INTC operates with a very robust, strengthening margin profile; Net Income versus Revenues over the past year was almost 27%, and improved in the last quarter to a little over 29%. This is a measurement that has reflected some of the internal difficulties they have dealt with, along with the impact of COVID-driven declines in its data center business throughout the year, but this could be a sign that better things are ahead. The fact is their operating profile gives INTC a lot of flexibility and continues to be a source of strength.
Free Cash Flow: INTC’s free cash flow is healthy; in the last quarter, it came in at $20.9 billion, which is an improvement from the $20.3 billion of the quarter prior, and significantly above the $16.9 billion at the end of 2019. That translates to a Free Cash Flow Yield of about 9%. The percentage is attractive, but the size of the actual number is a reflection of the company’s operating strength, which should serve it well even if broad economic uncertainty and concern about its data center business continues; it will also help management navigate the still-to-be-determined approach to 7nm production.
Debt to Equity: INTC has a debt/equity ratio of .42. This is a conservative number. The company’s balance sheet indicates that operating profits are adequate to service their debt, with $23.8 billion in cash and liquid assets (down from $25.8 billion in mid-2020, but still healthy) versus $16 billion in long-term debt. It is noteworthy that their current long-term debt is significantly lower than the $36 billion reported in the quarter prior. With a healthy operating margin profile along with a sizable cash position, servicing their debt isn’t a problem.
Dividend: INTC pays an annual dividend of $1.39 per share, which translates to a yield of 2.21% at the stock’s current price. It should also be noted that management announced it is raising the dividend at the beginning of the year from $1.32 per share – which should be taken as an indication of further fundamental strength.
Price/Book Ratio: there are a lot of ways to measure how much a stock should be worth; but I like to work with a combination of Price/Book and Price/Cash Flow analysis. Together, these measurements provide a long-term, fair value target around $68 per share. That means that INTC is trading at a 9% discount right now. That also means that a practical discount price is at around $54.40.
Technical Profile
Here’s a look at the stock’s latest technical chart.
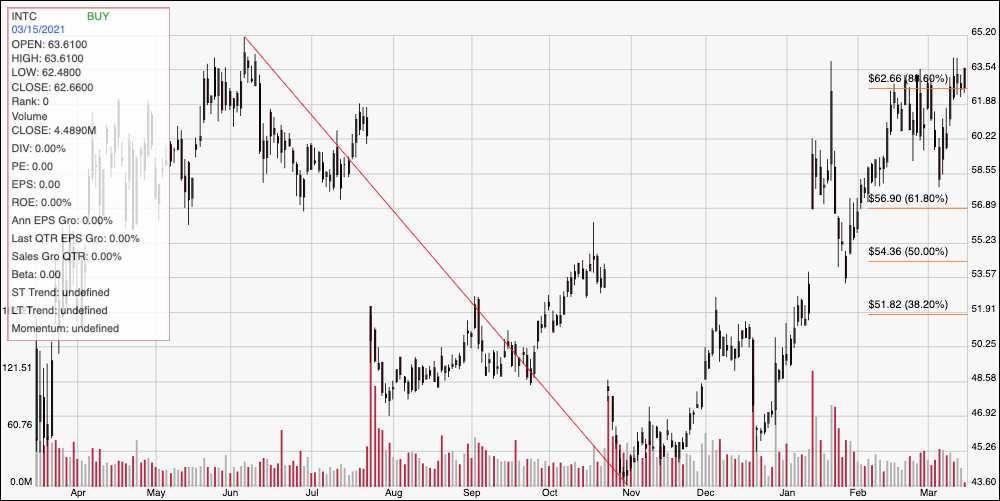
Current Price Action/Trends and Pivots: The chart above displays the last year of price activity for INTC. The red diagonal line traces the stock’s drop to a bear market low in November a little below $44; it also provides the baseline for the Fibonacci retracement line on the right side of the chart. After following the sector to a nice peak at around $63 in June, the stock gapped back down at the end of July to a low at around $47. After climbing back to a high a little above the 38.2% retracement line around $53.50 in October, the stock gapped back down again after that quarter’s earnings report. A temporary rally in late December saw it climb to about $51 before falling back again where it found a pivot low at around $45 and began climbing again. The overnight gap in mid-January came when the change of the CEO was announced, with the market pushing the stock to a peak at about $62.50 on the day earnings were released. From that point, the stock fell back again to about $55 before building new momentum in February and into the last week a little above that $62.50, January high. The stock now seems to be using that level as support, suggesting that the next push higher should test the stock’s 52-week high at around $65, with additional room to reach about $67 if bullish momentum continues. A drop below support at $62.50 could see the stock find next support anywhere between $58 and $60, based on the stock’s last pivot low earlier this month.
Near-term Keys: I think INTC’s overall fundamental strength remains very healthy, however the stock’s recent push higher is starting to shorten the opportunity that remains. With less than 9% long-term upside to my fair value target, I think there are a number of other stocks out there you can find with more attractive value propositions. If you prefer to focus on short-term trading strategies, a push higher, off of support at around $62.50 could provide a good bullish signal to buy the stock or work with call options, using $65 as a practical, near-term profit target. If the stock drops below $62.50, you could also consider shorting the stock or buying put options, but keep in mind that next support is probably around $60 unless bearish momentum really accelerates; in that case, $58 is more likely as a profit target on a bearish trade.