Over the last few weeks, the market has started to get choppier, which generally means that it’s harder to determine whether investors are bullish or bearish. That’s a sign of uncertainty about market direction, and I’ve noticed that an increasing number of analysts have started to talk or write about something I’ve believed for some time, and that is that the markets have been pricing the optimism about the a “return to normal” for a long time into stock prices. The notion that more people are starting to notice it, and investors may be adjusting their own positions on that basis, isn’t categorically a sign the market is about to reverse, but it could provide a technical basis for the market to stay choppy for the time being. I think that means that the market could have a hard time finding a catalyst to drive to new highs, while recent support levels around -5% off of the latest highs could get retested in the days or weeks ahead.
Choppy markets tend to make things difficult for short-term traders, especially those that focus on momentum, trend and swing-based trading methods. They are a big reason why the probabilities of success in those kinds of trades are historically very low; my own personal experience agrees with other studies I’ve read over the years about these strategies that indicate traders should only expect to be right 20% to 25% of the time. It’s also a primary reason my focus shifted away from those strategies to more conservatively-minded, fundamentally focused and value-driven, long-term methods.
Focusing on stocks that I think are trading at a useful discount keeps me away from the high fliers that analysts like to buzz about, but it’s also a pretty useful way to find stocks that I think represent less short-term price risk than stocks at the stop of extremely extended upward trends. When the market starts to get choppy as it is now, it can also be a good way to identify stocks that, while not immune to the same choppiness, are generally better suited to uncertain conditions. The Consumer Staples sectors, and Food Products stocks in general are a terrific example.
The sector generated a lot of buzz last year because of the pandemic-imposed shift to eating at home, but fell a bit out of favor at the end of last year and the beginning of 2021 as the market was busy baking the much-anticipated “return to normal” into stock prices. That prompted investors to dismiss these stocks despite a lot of fundamental strength in the industry and valuations that I continue to find very attractive – but that in the last few weeks has picked up very positive momentum.
I tend to agree with some estimates that are predicting eating at home to be a “sticky” trend because of the savings that families have generally been able to see as a result. Remember that unemployment is still very high, and both Fed chair Jerome Powell and Treasury Secretary Janet Yellin have reiterated that while they see positive signs of economic growth ahead, we aren’t there yet. Pandemic exhaustion is absolutely a thing; but there is still long way to go to put COVID in the rear view mirror. I think that among other things, this means that families are going to have to stay budget-conscious, especially about keeping their pantries, fridges and freezers stocked. That is the stickiness that I think is likely to extend through 2021.
Kellogg Company (K) is a good example of what I mean. They do a lot more than just cereal, of course, but the truth is that the cereal aisle is where you recognize them the most quickly. After following the broad market to a bearish low in March 2020 around $54, the stock rebounded to a peak in late July at nearly $73. From that point, the stock dropped back into a clear downward trend that bottomed in late February around $55 and has seen the stock rebound to its current level around $64. Even with the rise in price, the most recent earnings report shows that K’s balance sheet remains healthy, with improving profit and operating margins and a healthy dividend providing good evidence of sustained fundamental strength. That’s why I think that, K’s value proposition is still a great reason to keep working with this stock. Let’s dive in to the numbers.
Fundamental and Value Profile
Kellogg Company is a manufacturer and marketer of ready-to-eat cereal and convenience foods. The Company’s principal products are ready-to-eat cereals and convenience foods, such as cookies, crackers, savory snacks, toaster pastries, cereal bars, fruit-flavored snacks, frozen waffles and veggie foods. Its segments include U.S. Morning Foods, which includes cereal, toaster pastries, health and wellness bars, and beverages; U.S. Snacks, which includes cookies, crackers, cereal bars, savory snacks and fruit-flavored snacks; U.S. Specialty, which represents food away from home channels, including food service, convenience, vending, Girl Scouts and food manufacturing; North America Other, which includes the U.S. Frozen, Kashi and Canada operating segments; Europe, which consists of European countries; Latin America, which consists of Central and South America and includes Mexico, and Asia Pacific, which consists of Sub-Saharan Africa, Australia and other Asian and Pacific markets. K’s current market cap is $21.8 billion.
Earnings and Sales Growth: Over the last twelve months, earnings declined about -5.5%, while revenues were 7.5% higher. In the last quarter, earnings we -5.5% lower, while sales increased 1.02%. The company operates with a healthy margin profile that did weaken in the last quarter, which is consistent with the pattern of decreasing liquidity as well. Over the last twelve months, Net Income during was 9.08% of Revenues, and declined in the last quarter, to 5.92%.
Free Cash Flow: K’s free cash flow is $1.48 billion and translates to a Free Cash Flow Yield of 7.27%. It should also be noted that Free Cash Flow has improved steadily in each quarter of the past year, from about $947 at the beginning of 2020 to $1.36 billion mid-year. This improvement is a strong counter to the negative patterns I just described and is the primary reason I think the declines are temporary.
Debt to Equity: K has a debt/equity ratio of 1.86. This is a high number, and makes them one of the most heavily leveraged stocks in the Food Products industry. Their balance sheet indicates that in the last quarter, cash and liquid assets were a little over $435 million, versus $6.7 billion in long-term debt. That marks a decline from the last quarter, when cash was $1.5 billion against $7 billion in long-term debt. The decline is a concern to be watched, but something that I expect to be a temporary occurrence.
Price/Book Ratio: there are a lot of ways to measure how much a stock should be worth; but I like to work with a combination of Price/Book and Price/Cash Flow analysis. Together, these measurements provide a long-term, fair value target around $91 per share, which means that K remains extremely undervalued, with about 42% upside from its current price. I should also mention that in mid-2020, this same analysis offered a $79 long-term target price, and $89 about a month ago before the latest earnings report.
Technical Profile
Here’s a look at the stock’s latest technical chart.
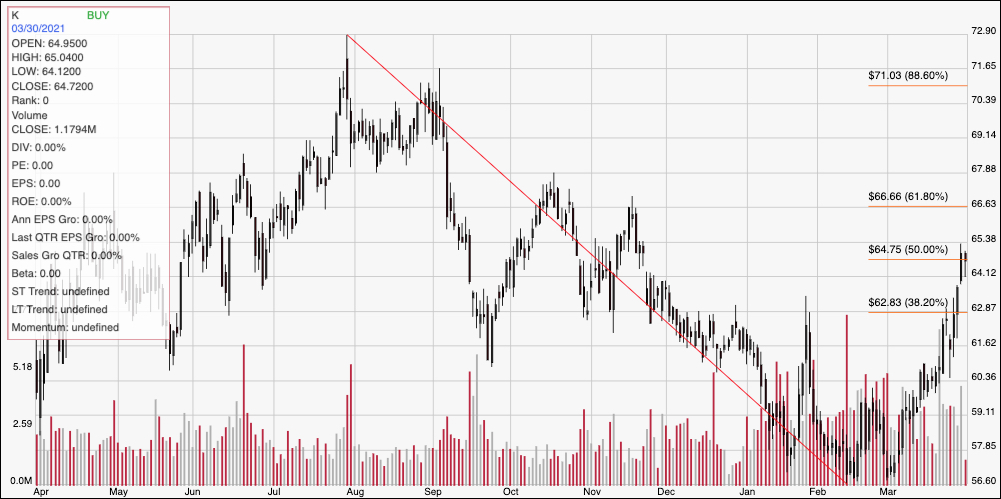
Current Price Action/Trends and Pivots: This chart traces the stock’s movement over the last year. The diagonal red line traces the stock’s downward trend from its late July 2020 peak at around $73 to its March low at around $57. It also provides the baseline for the Fibonacci retracement lines shown on the right side of the chart. From that low, the stock’s momentum has turned clearly bullish, pushing the price to the 50% retracement line as of this writing at around $64.50 per share, and marking current resistance, with next resistance at around $66.50 where the 61.8% retracement line sits. Current support is around $63, a little above the 38.2% retracement line. If the stock’s current momentum continues, the stock could push above both immediate and next resistance quickly, finding tertiary resistance at around $68 based on pivot activity in October and June of last year. A drop below support at around $63 could see the stock find next support between $59 and $60.
Near-term Keys: Even with K’s current upward trend, the value proposition on this stock is compelling. If you’re willing to accept the possibility of some near-term volatility, K is a stock that offers an excellent long-term opportunity. If you prefer to focus on short-term trading strategies, you could use a push above resistance at $64.50 as a signal to consider buying the stock or working with call options; but the smart approach in this case would be to work with very short-term price targets, with next resistance at around $66.50 to $68 offering good exit points. A drop below $63, on the other hand could provide a useful signal to consider shorting the stock or buying put options, using $60 to $59 as a useful profit target on a bearish trade.