The Consumer Discretionary sector cuts a wide swath across the economic landscape of the United States. It’s easy to think about the sector as the place you’ll find retail stocks, but the truth is that there are a lot of other businesses within the sector that are much more than just the department stores and restaurant chains that you might normally think about.
Within the sector, there is an industry called Specialty Retail, and this industry is the category where you’ll often find retail businesses and stores that each have a unique, specific focus; the interesting thing about the industry is the wide range of business types you’ll find. Think Best Buy (BBY), Home Depot (HD), and Foot Locker (FL), to name just a few, and you start to get an idea about the diversity of business types the industry covers.
Penske Automotive Group Inc (PAG) is a company in the Specialty Retail industry that you’ve probably heard of, but wouldn’t naturally think of as a retail stock. It isn’t all that unusual to see a Penske moving truck moving along any of America’s highways, so this is a stock with immediate name-brand recognition and a large international footprint in their specific niche. Like most companies with any kind of a retail dependency, the company experienced its share of difficulties during 2020; while some of those challenges can be seen today in the fundamental metrics I like to rely on, there are also some interesting indications that the company has weathered the past year in pretty good shape. The stock has also followed the broad market’s trend higher over the past year, rising from around $28.50 last April to a high last month at around $86 per share.
From that point, PAG has dropped back to find a consolidation range in the $79 to $80 range. Against the backdrop of the larger, intermediate upward trend, that could offer an interesting technical set up for a bullish opportunity. Does the stock’s long upward trend mean the stock has limited value-based upside, or is there a practical case to make for even higher prices as the U.S. economy is expected to continue its recovery through the rest of the year?
Fundamental and Value Profile
Penske Automotive Group, Inc. is an international transportation services company. The Company operates automotive and commercial truck dealerships principally in the United States, Canada and Western Europe, and distributes commercial vehicles, diesel engines, gas engines, power systems, and related parts and services principally in Australia and New Zealand. The Company’s segments include Retail Automotive, consisting of its retail automotive dealership operations; Retail Commercial Truck, consisting of its retail commercial truck dealership operations in the United States and Canada; Other, consisting of its commercial vehicle and power systems distribution operations and other non-automotive consolidated operations, and Non-Automotive Investments, consisting of its equity method investments in non-automotive operations. The Company holds interests in Penske Truck Leasing Co., L.P. (PTL), a provider of transportation services and supply chain management. PAG’s current market cap is $6.4 billion.
Earnings and Sales Growth: Over the last twelve months, earnings increased 99%, while revenues we -1.18% lower. In the last quarter, earnings were -13% lower while sales declined by 2.7%. The company operates with a very narrow margin profile, that is showing increased strength; Net Income was 2.66% of Revenues over the last twelve months, and 3.44% in the most recent quarter. Consider that these metrics were both a little below 2% before the pandemic swept the globe, and this could be an interesting early sign of improvement in the quarters ahead
Free Cash Flow: PAG’s free cash flow is strong, at more than $1 billion. That translates to a Free Cash Flow Yield of 15.95%, which is very attractive. It is also worth noting this number was around $442.5 million a year ago – which appears to validate the strengthening picture I described using Net Income versus Revenues above.
Dividend Yield: PAG’s dividend is $1.72 per share, and translates to an annual yield of about 2.13% at the stock’s current price. Like many companies, PAG suspended its dividend payout in 2020 in response to COVID-19, but then also reinstated it in the fourth quarter of the year, which is something that can be taken as a strong indication of management’s confidence in their ability to keep growing the business in the quarters ahead.
Debt to Equity: PAG has a debt/equity ratio of .48. This is a generally conservative number that typically suggests debt management shouldn’t be a problem; however the balance sheet shows that PAG’s cash and liquid assets were only $49.5 million in the last quarter versus $1.6 billion of long-term debt. Cash declined from about $469 million a year ago, which I take as a reflection of the realities they and so many other businesses were forced to confront in the past year. The improving Free Cash Flow and Net Income picture should translate to an improvement in this metric in the quarters ahead, which makes this element worth paying close attention.
Value Proposition: there are a lot of ways to measure how much a stock should be worth; but I like to worth with a combination of Price/Book and Price/Cash Flow analysis. Together, these measurements provide a long-term target at about $91 per share. That suggests PAG is undervalued by about 15% right now, which is interesting. Adding price to earnings growth to the method factors in the potential impact of future earnings, which can be a practical way to think about what the stock may be able to do in strengthening economic conditions; in that case, the stock’s long-term target rises to about $98, suggesting that the stock is discounted right now by about 24%.
Technical Profile
Here’s a look at the stock’s latest technical chart.
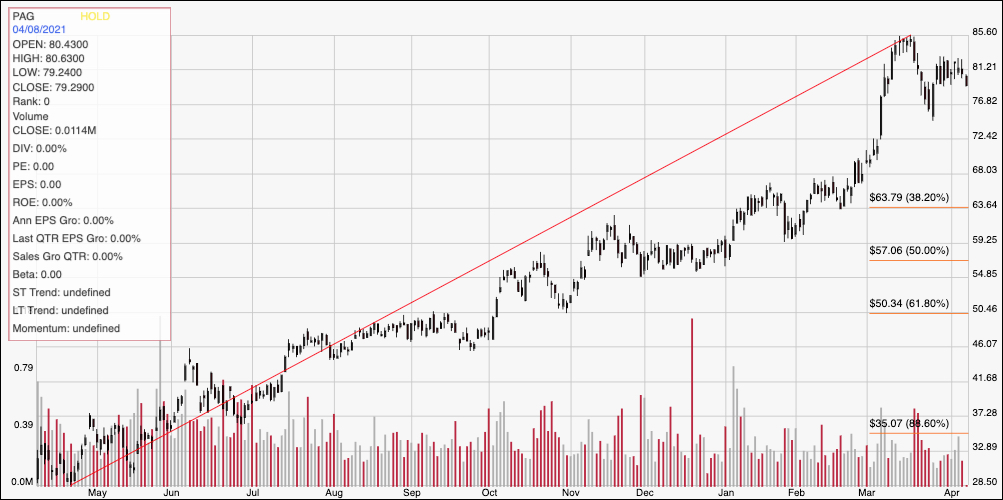
Current Price Action/Trends and Pivots: The chart above displays the stock’s price activity over the past year; the red diagonal line also provides the baseline for the Fibonacci retracement lines on the right side of the chart. The red line follows the stock’s upward trend from a low at around $28.50 a year ago to its night in March at about $86. The stock dropped back to a low point at around $75 a couple of weeks ago, marking its current support level, with immediate resistance just a little above the stock’s current price at around $81 per share. A push to $81.50 should give the stock room to push to about $86 to test its March, 52-week high point, while a drop below $75 could see additional downside to about $68 based on pivot highs around that level in February.
Near-term Keys: PAG is a company whose fundamental metrics reflect both the difficulties in the past year in the form of narrow liquidity against relatively high total long-term debt; but at the same time it also reinstated its dividend payout, increased Free Cash Flow as well as its Net Income. Altogether, I think it makes the stock’s overall value proposition more interesting, even with its extended upward trend. If you prefer to focus on short-term trading strategies, you can use a push to $81.50 as a signal to think about buying the stock or working with call options, using $85.50 to $86 as a useful bullish target. A drop below $75 would be a strong signal to consider shorting the stock or working with put options, using $68 as an attractive profit target on a bearish trade.