The market’s resilience over the past year can be considered a few different ways. A skeptic, or even just a conservative investor can point to the stock’s massive rally off of March 2020, bear market lows as an indication of investor’s desire to look beyond pandemic-driven pressures and concerns to the eventual, long-anticipated recovery and return to normal social activities. We’re not quite to that point, of course, but increasing vaccinations and generally declining infection and hospitalization rates all seem to provide positive indications that it isn’t too far off.
The market has always demonstrated a tendency to anticipate or “price in” its future expectations into stock prices, which is certainly one of the simplest explanations for the market’s bullish trend over the past year. Another is the fact that, in order to survive corporations all over the world were forced to pivot quickly and shift their operational models to remote, work-from-home models. While other areas of the economy were forced to dramatically reduce or shut down activity altogether, is also managed to keep a lot of people employed and blunt historically high unemployment numbers that frankly could have been much, much worse. Add to the mix massive federal spending that included direct payments to all Americans, and it isn’t surprising that early in the year economic reports showed increasing savings rates.
Increased saving also means that more and more people were looking for other ways to put their money to work for them in productive ways, which opens the door for companies that offer investment services and vehicles. That includes exchange-traded funds (ETFs), which can be thought of as a more actively traded variation on a mutual fund. ETFs are pools of investor funds that are invested in dedicated areas of the market – industries, sectors, or even set up to mimic the movement of market indices like the S&P 500. ETFs are unlike index funds or straight mutual funds, because they trade as actively and frequently as individual stocks; there are even equity options based on many of these ETFs that give active investors ways to make investments based on those pockets of industry or the economy in just as many variations as regular stocks.
State Street Corp (STT) is a company that may be more easily recognized by the State Street SPDRs, a family of ETFs that are among the most established and widely traded in the industry. The stock has followed the broad market’s trend to high a fresh 52-week high at around $88 just a few days ago. From that point, the stock has dropped back a little more than -10% from that point; that could set up a useful opportunity in a stock with a very solid balance sheet and interesting value proposition. Let’s dive in.
Fundamental and Value Profile
State Street Corporation is a financial holding company. The Company operates through two lines of business: Investment Servicing and Investment Management. The Company, through its subsidiary, State Street Bank and Trust Company (State Street Bank), provides a range of financial products and services to institutional investors across the world. Investment servicing line of business performs functions, such as providing institutional investors with clearing, settlement and payment services. The Company operates investment management line of business through State Street Global Advisors (SSGA). SSGA provides a range of investment management, investment research and investment advisory services to corporations, public funds and other investors. Its clients include mutual funds, collective investment funds and other investment pools, corporate and public retirement plans, insurance companies, foundations, endowments and investment managers. STT has a market cap of about $27.4 billion.
Earnings and Sales Growth: Over the last twelve months, earnings declined about -12%, while revenues were -9.64% lower. In the last quarter, earnings were -13% lower, while sales were flat but positive by 0.78%. The company operates with a healthy margin profile that did weaken in the last quarter. Over the last twelve months, Net Income during was 19.6% of Revenues, and declined in the last quarter, to 17.57%.
Free Cash Flow: STT’s free cash flow is $2.97 billion and translates to a Free Cash Flow Yield of 10.85%. It should also be noted that Free Cash Flow has declined through most of the past year; it was $9.5 billion a year ago.
Debt to Equity: STT has a debt/equity ratio of 0.6. This is a low number that reflects a conservative approach to leverage. Their balance sheet indicates that in the last quarter, cash and liquid assets were a little over $118 billion, versus $13.8 billion in long-term debt.
Price/Book Ratio: there are a lot of ways to measure how much a stock should be worth; but I like to work with a combination of Price/Book and Price/Cash Flow analysis. Together, these measurements provide a long-term, fair value target around $89 per share, which means that STT is undervalued, with about 13% upside from its current price.
Technical Profile
Here’s a look at the stock’s latest technical chart.
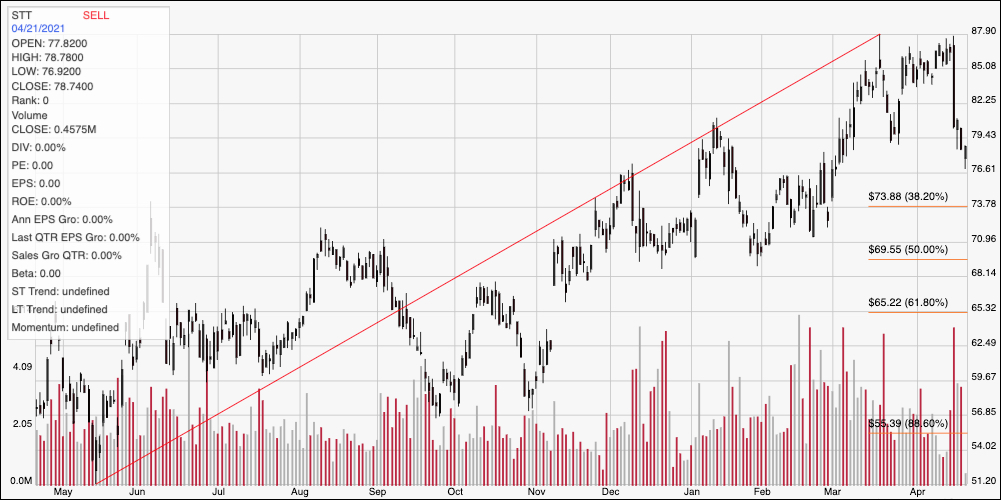
Current Price Action/Trends and Pivots: This chart traces the stock’s movement over the last year. The diagonal red line traces the stock’s upward trend to its recent peak at around $88. It also provides the baseline for the Fibonacci retracement lines shown on the right side of the chart. The stock has dropped sharply off of that high, and is just a few dollars away from expected support at around $74 where the 38.2% retracement line rests. Immediate resistance is around $79.50 based on a pivot high in January. A push above $79.50 should have short-term upside to about $85, while a drop below support could see the stock fall to the 50% retracement line at around $69.50 before finding next support.
Near-term Keys: STT has an interesting, but not quite compelling value proposition. The stock’s current, strong bearish momentum might suggest waiting to see if the stock can start to consolidate around support between its current price and $74 before looking for an opening to buy the stock on a long-term value-focused basis. If you prefer to focus on short-term trading strategies, a bounce off of support could also offer and interesting short-term signal to buy the stock or work with call options, using $85 as a useful bullish target. A drop below $74 could act as a signal to short the stock or buy put options, with $69.50 offering a good bearish target.