One of the things that I think has been driving the market’s big bullish trend from the initial, bear market bottom the market visited briefly in early 2020 is generally increasing savings rates during the pandemic. I think that was driven, at least in part by the fact that remote workers were limited by shelter-in-place orders from engaging in traditional leisure and social activities. Bored, with a need to do something with their money other than just letting it sit in bank accounts paying practically zero interest, the stock market has offered an easy alternative. Direct payments from the federal government that have been part of stimulus spending only bolstered those savings – and so those investments – even more.
As the economy reopens and vaccination levels continue to rise, most analysts are pointing to an increase in those same leisure and social activities as areas most likely to see significant increases in economic activity. That also suggests that discretionary funds consumers may have previously directed to market investments could now be used to pay for those activities. That’s a positive for industries like travel, hospitality, and so on – but it could also act as a drag on results for the companies that have serviced savings and investment accounts over the past year.
Charles Schwab Corp (SCHW) is one of the largest companies in the financial sector, offering a wide range of financial services to individuals as well as institutions. The stock price for this company has mirrored the market’s upward trend for the past year, rising from a bear market low in the $26 range to a recent high at around $68. Much of that increase can be tied to improvements in the company’s profitability measurements; but the really interesting part of this company’s story is that, despite the major increase in price, the stock still offers and interesting discount for a value investor.
The long-term, upward trend has seen a dramatic pause over the past couple of weeks, dropping from that high at close to $69 to a recent pivot low point at around $63 per share. For most growth investors, that pullback offers an interesting new potential set up; but at the top of an already extended upward trend, it could also mark a potential trend reversal point, with plenty of downside. Is the stock worth the risk right now, or does the downside offset the potential long-term reward?
Fundamental and Value Profile
The Charles Schwab Corporation (CSC) is a savings and loan holding company. The Company, through its subsidiaries, engages in wealth management, securities brokerage, banking, asset management and financial advisory services. The Company provides financial services to individuals and institutional clients through two segments: Investor Services and Advisor Services. The Investor Services segment provides retail brokerage and banking services, retirement plan services and other corporate brokerage services. The Advisor Services segment provides custodial, trading, and support services as well as retirement business services. The Company offers a range of products to address individuals’ varying investment and financial needs. Its product offerings include brokerage, mutual funds, exchange-traded funds (ETFs), advice solutions, banking and trust. Brokerage provides a range of brokerage accounts with cash management capabilities. SCHW has a market cap of about $122.9 billion.
Earnings and Sales Growth: Over the last twelve months, earnings increased 40%, while revenues were 80% higher. In the last quarter, earnings were 13.5% lower, while sales were almost 13% higher. The company operates with a healthy margin profile that increased in the last quarter. Over the last twelve months, Net Income was almost 29% of Revenues, and improved in the last quarter, to 31.5%.
Dividends: SCHW pays a dividend of $.72, which translates to an annualized yield of 1.1% at the stock’s current price.
Free Cash Flow: SCHW’s free cash flow is $6.22 billion and translates to a Free Cash Flow Yield of 5.27%. It should also be noted that Free Cash Flow dropped during the pandemic from a high a year ago at around $21.3 billion, but increased from -$2.76 billion in the quarter prior.
Debt to Equity: SCHW has a debt/equity ratio of 0.28. This is a low number that reflects a conservative approach to leverage. Their balance sheet indicates that in the last quarter, cash and liquid assets were a little over $90.7 billion, versus $13.6 billion in long-term debt.
Price/Book Ratio: there are a lot of ways to measure how much a stock should be worth; but I like to work with a combination of Price/Book and Price/Cash Flow analysis. Together, these measurements provide a long-term, fair value target around $82 per share, which means that SCHW is nicely undervalued, with about 27% upside from its current price.
Technical Profile
Here’s a look at the stock’s latest technical chart.
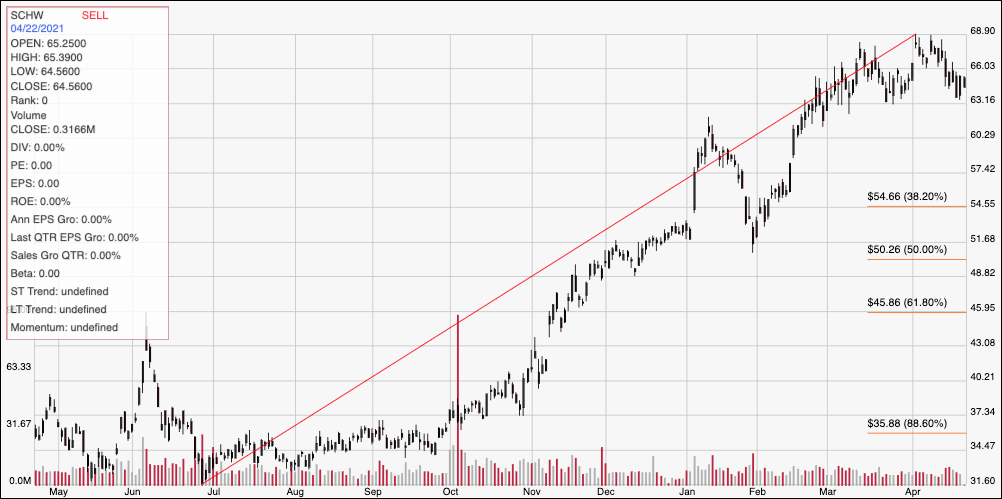
Current Price Action/Trends and Pivots: This chart traces the stock’s movement over the last year. The diagonal red line traces the stock’s upward trend to its recent peak at around $69. It also provides the baseline for the Fibonacci retracement lines shown on the right side of the chart. From the high point, the stock has retraced, bouncing early this week off of current support at around $63, with immediate resistance at $69. A drop below $63 should find next support at around $60, while a push above $69 could see upside to about $75 (the distance between current support and resistance).
Near-term Keys: SCHW has a very tempting value proposition. The stock’s pullback from its high point earlier this month looks like a classic pullback within the longer trend; but the stock’s current support point at $63 also marks an important potential bearish signal point. A drop below that level could offer a significant bearish signal for a short-term trade by shorting the stock or buying put options, with a short-term target at around $60 and a secondary target at around $54.50 where the 38.2% retracement line. That also means that a drop below $60 could be an early sign the stock’s long-term trend is about reverse. If the stock continues to bounce off of support at $63, it could be a good opportunity to buy the stock or work with call options, with short-term upside to $69 and a secondary target at around $72 if bullish momentum increases.