More and more this year, consumers have been thinking about the activities they’ve been deprived from enjoying because of pandemic-driven restrictions, and what they might want to do as the economy starts to reopen. For the market, that’s good news that has prompted investors to start paying more attention to companies in industries that traditionally have been sensitive to economic cycles. That includes the Consumer Discretionary sector, where industries including Automobiles all had to deal with dramatic operational shutdowns and cratered demand last year.
Harley-Davidson Inc. (HOG) isn’t an auto company, of course; but they are categorized in the same market space as auto stocks. This is a stock that followed a multiyear downward trend to a March 2020, bear market bottom at around $14, but that investors seemed to begin to treat as an attractive bargain opportunity; it has more than tripled in value from that point, and started picking up even more bullish momentum in the last week around its latest earnings report; it surged from around $36 to a current high point at around $48.
HOG is a company with an interesting fundamental profile; there are a number of elements that indicate strength, including a stable dividend management was able to maintain throughout the pandemic, good liquidity and strong Free Cash Flow. Much of the stock’s rally over the past year was attributed to significant direct payments by the federal government to Americans throughout the past year that helped mitigate broad declines in sales and boost the company’s profitability. Even so, many analysts point to aging demographics among HOG’s traditional customer base (boomers and Generation Xers) that they predict will moderate sales over the next year or so. The company itself has acknowledged a shift over the last couple of years in consumer trends away from motorcycles (including the kind of heavy bikes the company is known for), most particularly in the United States.
That bearish narrative doesn’t really line up with the company’s earnings and revenues pattern over the last year, however, or with other signs that the company not only has weathered the pandemic so far in very good shape, but also that their healthy Free Cash Flow, increasing Net Income and manageable debt give the company a lot of flexibility to continue focusing on a 5-year strategic plan to build consistent revenue and earnings growth. Given the stock’s runup in price, it’s safe to say that the investing public is betting with the company and discounting analyst pessimism; but what does that mean for the stock’s value proposition? Let’s find out.
Fundamental and Value Profile
Harley-Davidson, Inc. is the parent company for the groups of companies doing business as Harley-Davidson Motor Company (HDMC) and Harley-Davidson Financial Services (HDFS). The Company operates in two segments: the Motorcycles & Related Products (Motorcycles) and the Financial Services. The Motorcycles segment consists of HDMC, which designs, manufactures and sells at wholesale on-road Harley-Davidson motorcycles, as well as motorcycle parts, accessories, general merchandise and related services. The Company manufactures and sells at wholesale cruiser and touring motorcycles. The Financial Services segment consists of HDFS, which provides wholesale and retail financing and insurance-related programs to the Harley-Davidson dealers and their retail customers. HDFS is engaged in the business of financing and servicing wholesale inventory receivables and retail consumer loans for the purchase of Harley-Davidson motorcycles. HOG has a current market cap of $7.4 billion.
Earnings and Sales Growth: Over the last twelve months, earnings increased more than 229%, while sales decreased almost 9.57%. Over the last quarter, the earnings growth was even bigger, at almost 482% (these are not typos), with sales rising a little over 96%. HOG;s operating profile also shows a significant improvement, with Net Income that grew from a modest 5.62% over the last twelve months to a robust 18.22% in the last quarter.
Free Cash Flow: HOG’s Free Cash Flow is healthy at more than $1.2 billion, and that marks an increase from about $817 million a year ago. The current number also translates to an impressive Free Cash Flow Yield of more than 18%.
Debt to Equity: HOG is among the most highly leveraged companies in its industry; it has a debt/equity ratio of 2.77. That measurement is a bit misleading in HOG’s case, however because they retain both healthy liquidity and more than adequate financial ability to service their debt with operating profits. In the last quarter, total cash and liquid assets were almost $3.4 billion, while long-term debt is a little less than $5.5 billion.
Dividend: HOG pays an annual dividend of $.60 per share. At the stock’s current price, that translates to a dividend yield of 1.25%. It is worth noting that pre-pandemic, HOG’s dividend was around $1.48 per share; but in an industry where many of the most recognizable and established companies were eliminating their dividend altogether, and have yet to reinstate them, the company’s ability to maintain their dividend payout is also noteworthy.
Price/Book Ratio: there are a lot of ways to measure how much a stock should be worth; but I like to worth with a combination of Price/Book and Price/Cash Flow analysis. Together, these measurements provide a long-term target at about $48 per share. That suggests that the stock is fairly valued at its current price; however, when we include the stock’s PEG ratio, which includes estimates for future growth, the value proposition becomes significantly more interesting, with a target price at around $60 – a little over 22% above the stock’s current price.
Technical Profile
Here’s a look at the stock’s latest technical chart.
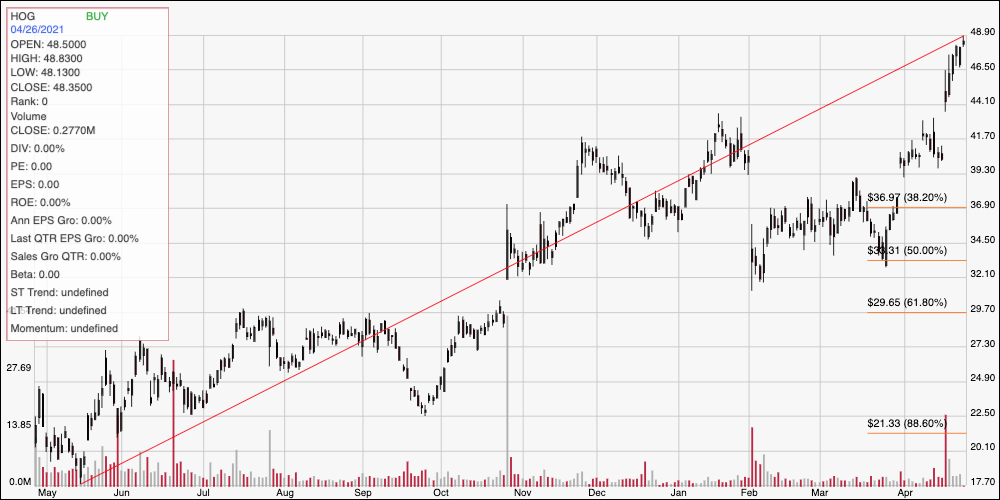
Current Price Action/Trends and Pivots: The red diagonal line traces the stock’s upward trend over the past year, including its current high point at nearly $49 per share right now. It also provides the baseline for the Fibonacci retracement lines on the right side of the chart. The stock has picked up bullish momentum in the last week, pushing above resistance at $42 to drive to its current high; that also means that identifying useful support or resistance levels requires going back in time further than our chart shows, to mid and late 2018 to find useful, previous reference points. On that basis, support could lie at around $46, with immediate expected resistance at around $53.
Near-term Keys: The stock’s current bullish momentum has already seen the stock make a big move, and should naturally beg the question of how much immediate upside is left; however if the stock finds support anywhere between its current price and $46, there could be a very attractive short-term opportunity to buy the stock or work with call options, with $53 providing a nice profit target on a bullish trade. A pivot off of the stock’s latest peak, with a drop below $46, however would be a strong signal to think about shorting the stock or buying put options, using the last resistance break at around $42 as a very nice profit target on a short-term, bearish trade. What about the stock’s value proposition? That depends on your willingness to accept management’s forecasts for future earnings growth, which is the biggest driver behind the long-term target price of $60 I mentioned earlier. If you are less convinced, the stock’s current value proposition as defined by traditional valuation metrics says the stock is fairly value right now, and would need to drop to about $38 to offer a practical, useful value.