Among a number of interesting storylines of the past year, is the way corporate America and the markets found ways to adjust and keep pushing forward. It’s true that a lot of the market’s rally can be tied directly to trillions of dollars of economic stimulus, including direct payments to families and individuals that helped dramatically increase savings rates during the pandemic. I think that was driven, at least in part by the fact that remote workers were limited by shelter-in-place orders from engaging in traditional leisure and social activities. Bored, with a need to do something with their money other than just letting it sit in bank accounts paying practically zero interest, the stock market has offered an easy alternative.
As the economy reopens and vaccination levels continue to rise, most analysts are pointing to an increase in the kinds of travel, leisure and social activities that we haven’t been able to enjoy for the past year as areas most likely to see significant increases in economic activity. That also suggests that discretionary funds consumers may have previously directed to market investments could now be used to pay for those activities. That’s a positive for industries like travel, hospitality, and so on – but it could also act as a drag on results for the companies that have serviced savings and investment accounts over the past year.
Interactive Brokers Group Inc (IBKR) isn’t one of the most recognizable names in the Financial sector. This is a company that built its reputation as a discount broker and market maker by appealing to active investors and day traders, and that over the years expanded its business by giving those accounts access to a widening range of electronic exchanges and market centers – for example, stocks, bonds, options, foreign exchange, and futures, all from a single account. That combination of specialization with comprehensive market access is appealing and has helped them establish themselves as an interesting alternative to larger, established names in the Capital Markets industry.
After following the rest of the market off of a bear market low in the first half of 2020 at around $35, the stock more than doubled in price, hitting a peak in early March above $80 per share. From that point, however the stock has retraced lower, finding support at the end of last week at around $70, and now appearing to consolidate just a little above that point. Considered against the context of the longer-term, upward trend, that pullback is interesting from a technical perspective, while the company’s fundamentals also appear to provide a strong basis to consider using the stock as a useful value-oriented investment right now.
Fundamental and Value Profile
Interactive Brokers Group, Inc. (IBG, Inc.) is a holding company. The Company is an automated global electronic broker and market maker specializing in routing orders, and executing and processing trades in securities, futures, foreign exchange instruments, bonds and mutual funds on over 120 electronic exchanges and market centers around the world and offering custody, prime brokerage, securities and margin lending services to customers. It operates in two segments: electronic brokerage and market making. It conducts its electronic brokerage business through its Interactive Brokers (IB) subsidiaries. It conducts its market making business through its Timber Hill (TH) subsidiaries. In the United States, it conducts its business from Greenwich, Connecticut and Chicago, Illinois. Outside the United States, it conducts business in Canada, England, Switzerland, Liechtenstein, China (Hong Kong and Shanghai), India, Australia and Japan. IBKR’s current market cap is $30.1 billion.
Earnings and Sales Growth: Over the last twelve months, earnings increased by about 42%, while revenues were nearly 43% higher. In the last quarter, earnings were also 42% higher, while sales grew by 36.5%. The company operates with a healthy margin profile that increased in the last quarter. Over the last twelve months, Net Income during was 9.39% of Revenues, and declined in the last quarter, to 11.98%.
Free Cash Flow: IBKR’s free cash flow is $8 billion and translates to a Free Cash Flow Yield of 26.6%. It should also be noted that Free Cash Flow has improved steadily in each quarter of the past couple of quarters, from about $4.2 billion at the in June of last year.
Dividends: IBKR pays a dividend of $.40 per share, and which translates to annualized yield of 0.55% at the stock’s current price.
Debt to Equity: IBKR has a debt/equity ratio of 0, which reflects the fact the company has no long-term debt. Their balance sheet indicates that in the last quarter, cash and liquid assets were a little over $56.4 billion. IBKR’s liquidity increased from $52 billion a year ago. This is an interesting element to think about; the company’s total cash is higher than the stock’s total market cap value.
Price/Book Ratio: there are a lot of ways to measure how much a stock should be worth; but I like to work with a combination of Price/Book and Price/Cash Flow analysis. Together, these measurements provide a long-term, fair value target around $94 per share, which means that IBKR is very undervalued, with about 31% upside from its current price.
Technical Profile
Here’s a look at the stock’s latest technical chart.
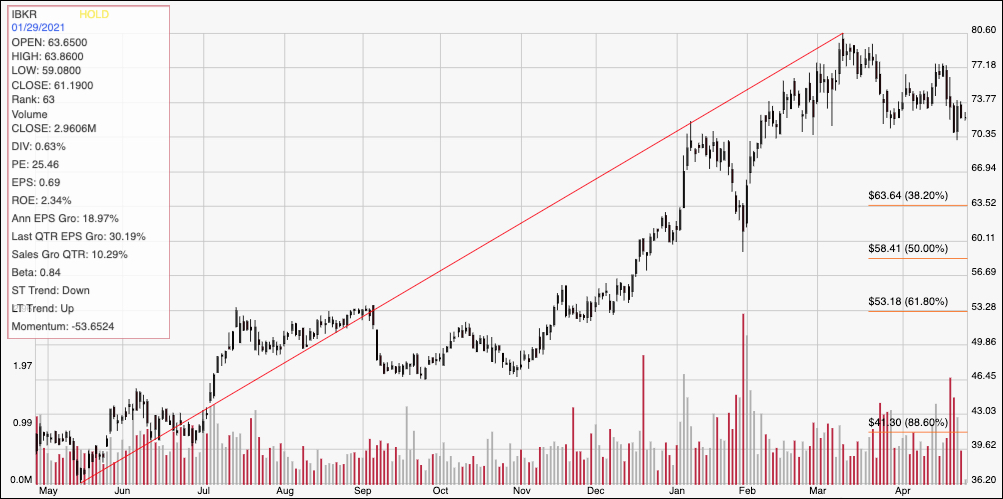
Current Price Action/Trends and Pivots: This chart traces the stock’s movement over the last year. The diagonal red line traces the stock’s upward trend from its late May 2020 low at around $36 to its March peak at around $80. It also provides the baseline for the Fibonacci retracement lines shown on the right side of the chart. The stock dropped back from that high, finding support at around $70 in the last few days before stabilizing around that level. Immediate resistance is at around $77, with secondary resistance at $80 if bullish momentum increases. A drop below $70 has downside to next support at around $63.50, based on pivot activity around that level in late January and December as well as the 38.2% retracement line.
Near-term Keys: IBKR’s value proposition on this stock is compelling, with an impressive amount of fundamental strength driving the stock’s current price. If you’re willing to accept the possibility of some near-term volatility, IBKR offers an excellent long-term opportunity. If you prefer to focus on short-term trading strategies, you could use the stock’s current bounce off of $70 as a signal to consider buying the stock or working with call options, with a near-term target at around $77. A drop below $70, on the other hand could provide a useful signal to consider shorting the stock or buying put options, using $63.50 as a useful profit target on a bearish trade.