Intel Corp (INTC) is a stock that I’ve followed for quite some time, and that I’ve written about in this space quite a bit over the past year. This is one of the 600-lb gorillas of the Technology sector, after all, and the company that is easily considered the gold standard of companies in the Semiconductor industry. That said, the stock mostly underperformed the rest of the Tech sector as well as the Semiconductor industry in 2020, as analysts and investors shared concerns about lost market share in the CPU space, especially in servers, to AMD along with increasing uncertainty about the path ahead for INTC’s 7nm production.
Despite a strong fundamental profile that included a healthy balance sheet, increasing Free Cash Flow, and strong liquidity throughout the past year, those issues were apparently enough to prompt a change in executive leadership, with Pat Gelsinger, a long-time Intel employee before leaving in 2009 to lead VMWare, taking over for Bob Swan. Since that change in leadership was announced, the stock surged in April, pushing from a January starting point at around $50 to a high point at around $68.50 before falling back to its current level at around $56.
The company’s latest earnings report shows that the fundamental strengths I just outlined still exist, with the market also seeming to buy into Mr. Gelsinger’s deliberate method to unraveling 7 nm production problems. In March, the company announced it would invest $20 billion to create Intel Foundry Services, a major expansion of Intel’s manufacturing capacity that starts by building two factories in Arizona with an intention to become a major global provider of semiconductor foundry capacity in the U.S. and Europe. The move looks like a great long-term opportunity to benefit from a global desire for non-Asia capacity.
Questions remain, of course about how quickly enterprise spending on IT infrastructure will rebound as the year progresses; this is a side of INTC’s business that held progress back in 2020 as businesses were forced to shift to work from home models that de-emphasized spending on traditional IT purchases. AMD’s capture of a big piece of that market at INTC’s expense has also shown an impact as well. The real question at this point is whether the company’s underlying fundamental strength, and new management’s efforts to reinvigorate INTC’s historical emphasis on innovation and internal production efficiency still combine to give value investors a reason to stay bullish about the stock’s long-term prospects. Let’s dive in.
Fundamental and Value Profile
Intel Corporation is engaged in designing and manufacturing products and technologies, such as the cloud. The Company’s segments are Client Computing Group (CCG), Data Center Group (DCG), Internet of Things Group (IOTG), Non-Volatile Memory Solutions Group (NSG), Intel Security Group (ISecG), Programmable Solutions Group (PSG), All Other and New Technology Group (NTG). It delivers computer, networking and communications platforms to a set of customers, including original equipment manufacturers (OEMs), original design manufacturers (ODMs), cloud and communications service providers, as well as industrial, communications and automotive equipment manufacturers. It offers platforms to integrate various components and technologies, including a microprocessor and chipset, a stand-alone System-on-Chip (SoC), or a multichip package. The CCG operating segment includes platforms that integrates in notebook, two in one systems, desktop computers for consumers and businesses, tablets, and phones. INTC’s current market cap is about $227 billion.
Earnings and Sales Growth: Over the last twelve months, earnings were down -4.14% while sales decreased by -0.78%. In the last quarter, earnings were -8.55% lower, while sales declined by -1.53%. INTC operates with a robust margin profile that weakened in the last quarter; Net Income versus Revenues over the past year was almost 24%, but weakened in the last quarter to a little over 17%. This is a measurement that has reflected some of the internal difficulties they have dealt with, along with the impact of COVID and competition-driven declines in its data center business.
Free Cash Flow: Despite declining somewhat versus the quarter prior, INTC’s free cash flow is healthy; in the last quarter, it came in at $19.2 billion, which is a decline from the $20.9 billion of the quarter prior. The current number translates to a Free Cash Flow Yield of about 8.3%. The drop on a quarterly basis is a concern, but the size of the actual number is also a reflection of the company’s operating strength, which should serve it well even if broad economic uncertainty and concern about its data center business continues, and also give the company the resources it needs to build its new foundry business.
Debt to Equity: INTC has a debt/equity ratio of .42. This is a conservative number. The company’s balance sheet indicates that operating profits are adequate to service their debt, with $22.3 billion in cash and liquid assets (down from $25.8 billion in mid-2020, but still healthy) versus $33 billion in long-term debt. With a healthy operating margin profile along with a sizable cash position, servicing their debt isn’t a problem.
Dividend: INTC pays an annual dividend of $1.39 per share, which translates to a yield of 2.43% at the stock’s current price. It should also be noted that management announced it is raising the dividend at the beginning of the year from $1.32 per share – which I consider an indication of further fundamental strength.
Price/Book Ratio: there are a lot of ways to measure how much a stock should be worth; but I like to work with a combination of Price/Book and Price/Cash Flow analysis. Together, these measurements provide a long-term, fair value target around $68 per share. That means that INTC is trading at a 17% discount right now.
Technical Profile
Here’s a look at the stock’s latest technical chart.
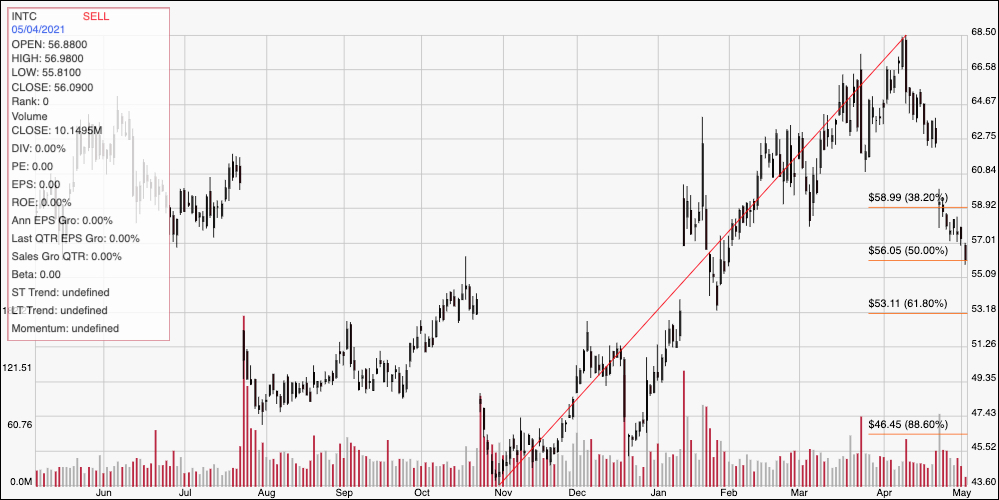
Current Price Action/Trends and Pivots: The chart above displays the last year of price activity for INTC. The red diagonal line traces the stock’s upward trend from a low at around October at $43.60 to a high at $68.50 per share last month. it also provides the baseline for the Fibonacci retracement lines on the right side of the chart. The stock has dropped back sharply from that high, and as of now is sitting very close to support at around $56 – a level that is also inline with the 50% retracement line. Considering the stock’s bearish momentum, a drop below $56 has additional downside to around $53 per share. A pivot off of support at around $56 has short-term upside to about $63 – the top of an overall gap about a week ago that happened around the company’s last earnings report.
Near-term Keys: I think INTC’s overall fundamental strength remains very healthy, while the stock’s current bearish momentum continues to improve the stock’s value proposition – but given the state of the stock’s current bearish momentum, taking a position means you must be willing to accept a high degree of volatility right now. If you prefer to focus on short-term trading strategies, a push higher, off of support at around $56 could provide a good bullish signal to buy the stock or work with call options, using $63 as an attractive, near-term profit target. If the stock drops below $56, you could also consider shorting the stock or buying put options, with next support at around $53 offering a practical short-term target on a bearish trade.