Investors can be divided into a lot of different categories. Day traders, swing traders, long-term investors these are just a few broad description you often hear used to describe some of the different attitudes about how to find and take advantage of opportunities that emerge in the marketplace. Even among long-term investors, there are important differences in attitude and preference about what kinds of stocks provide the best probabilities of long-term success.
Traditional, growth-oriented investing tends to put a lot of emphasis on stocks that have already started moving up, which makes sense when you consider the popular market idiom that a “stock tends to follow the direction of its next longer trend.” That generally means that when you can clearly see a stock going up, it should continue to go up. It’s a forecast that often supports itself, as a larger number of growth-focused investors recognize the strength of a stock’s trend and start to buy in themselves. That keeps the momentum going and often extends even long-term trends (9 months to 1 year) into multiyear patterns of growth.
My personal preference runs a bit counter to the growth-oriented mindset, and is commonly called contrarian investing. This is a term that often seems to be correlated in equal fashion with value investing, which is where I think my method actually falls. In simplest terms, value investing means looking at a company’s book of business and trying to determine how closely it may be correlated to the stock’s current trading price. If a stock’s price is relatively low in comparison, it usually means the stock is trading at a useful discount. More often than not, that also means that the stock will actually be at or near historical lows – which is why this approach requires a “contrarian” mindset. Where most growth-oriented investors tend to dismiss stocks that have been dropping, value investors use those patterns as opportunities to start diving into the business details.
Growth and value-focused investing are not always mutually exclusive; sometimes, a stock will draw a clear pattern of long-term growth in price while the company’s book of business also continues to grow. The extent to which the two keep pace with each other can ultimately mean that a company continues to offer an interesting, useful value proposition even as the stock price rises – but to be honest, this is something that doesn’t happen very often. More often than not, a stock’s price will increase faster than the company’s growth.
Newell Brands Inc. (NWL) is an interesting example. This is a stock that has risen from a low point around $11 in May of last year to a recent peak at around $30 this week. This is a stock with a large footprint in the Household Durables industry, with well-known brands in a portfolio lineup that includes Sharpie and Paper Mate writing utensils, Graco baby products, Rubbermaid, Elmer’s, Mr. Coffee, and much more. The business has been working for most of the last few years to implement a transformation plan that recent earnings reports suggest have started to positively impact the company’s bottom line, which has given the market justification to push the stock higher. The question for a value-focused investor like myself, of course, is whether NWL’s fundamentals are improving enough to keep pace with the stock’s increase in price, or has the stock extended itself to overvalued levels? Let’s take a look.
Fundamental and Value Profile
Newell Brands Inc. is a consumer goods company. The Company has a portfolio of brands, including Paper Mate, Sharpie, Dymo, EXPO, Parker, Elmer’s, Coleman, Marmot, Oster, Sunbeam, FoodSaver, Mr. Coffee, Graco, Baby Jogger, NUK, Calphalon, Rubbermaid, Contigo, First Alert and Yankee Candle. The Company operates under three segments: Food and Appliances (comprised of Appliances & Cookware and Food divisions), Home and Outdoor Living (comprised of Home Fragrance, Outdoor & Recreation and Connected Home & Security divisions), and Learning and Development (comprised of Writing and Baby & Parenting divisions). NWL has a current market cap of $11.9 billion.
Earnings and Sales Growth: Over the last twelve months, earnings increased 233.33%, while sales improved 21.3%. In the last quarter, earnings declined by -46.43% while sales declined almost -15%. The company’s margin profile reflects the pandemic-driven challenges of the past year, over the last twelve months Net Income was 6.11% of Revenues, and weakened to 3.87% in the last quarter. In the quarter prior, the annual number was negative, which means that the current number is a positive sign of progress.
Free Cash Flow: NWL has healthy free cash flow of $1.13 million over the last twelve months. This number was just $295 million at the beginning of this 2019, making Free Cash Flow growth a useful benchmark for the success so far of the company’s transformation plan. Their current Free Cash Flow number translates to a useful Free Cash Flow Yield of 9.16%.
Debt to Equity: the company’s debt to equity ratio is 1.33, which is a bit high and is reflected in the company’s balance sheet. As of the last quarter, cash and liquid assets were $682 million (down from $981 in the last quarter) versus a little more than $5.1 billion in long-term debt. It is worth noting that in late 2018, long-term debt was about $9.3 billion, so this number has been declining steadily, which is a net positive. Considering the positive pattern of Free Cash Flow and their improving operating profile, debt service is not an issue.
Dividend: NWL pays an annual dividend of $.92 per share, which translates to a very attractive annual yield of 3.28% at the stock’s current price.
Price/Book Ratio: there are a lot of ways to measure how much a stock should be worth; but I like to work with a combination of Price/Book and Price/Cash Flow analysis. Together, these measurements provide a long-term, fair value target around $25.43 per share. That means that at the stock’s current price, it is overvalued, with -9% upside from its current price. A practical bargain price is around $20.34.
Technical Profile
Here’s a look at the stock’s latest technical chart.
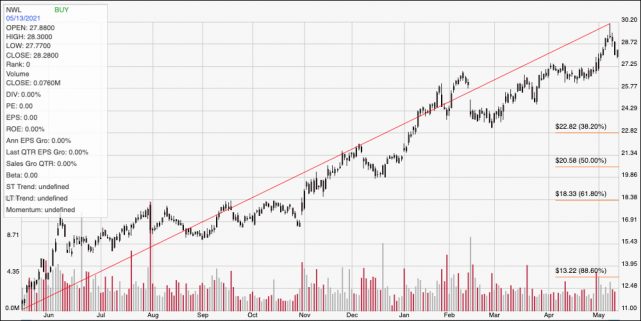
Current Price Action/Trends and Pivots: The chart above displays the stock’s price performance over the last year. The diagonal red line traces the stock’s upward trend from its low last May at around $11 to its peak this week at around $30. It also informs the Fibonacci retracement lines shown on the right hand side of the chart. The stock has dropped in the last couple of days, with support expect to lie a little above $27. A break above $30 should have about $3 of near-term upside, based on the distance between current support at $27 and immediate resistance at $30, while a drop below $27 has downside to about $24.50.
Near-term Keys: Overall, I like NWL’s fundamentals; management has been effective at executing its transformation strategy over the last year or so, and even with COVID-related pressures, those gains have helped to maintain, and in some cases even bolster its balance sheet and operating cash flow. Unfortunately, the stock’s overvalued status makes it hard to forecast more gains for the stock from its current high. I think it might be smarter to wait and see if the stock drops to a more useful bargain price at around the $20 to $21 level. If you prefer to work with short-term trading strategies, a bounce of off support around $27 could offer a useful opportunity to buy the stock or work with call options, using the stock’s peak at $30 as a practical profit target, with additional upside to $33 if the stock breaks above that resistance. A drop below $27 could be a good time to consider shorting the stock or buying put options, using $24.50 as useful, early profit target on a bearish trade.