There is a lot of fundamental data that I rely on to help paint an overall picture about underlying strength of any stock I might consider using for a value-based investment. While some fundamental investors prefer to work with easy-to-reference, quick-glance data like earnings per share, I prefer to expand my view of a company’s profitability by also looking at the company’s pattern of Net Income and Free Cash Flow growth.
Earnings per share is a useful, standardized method of describing a company’s profit in a given period on a per-share basis; but it is also a number that can be calculated a number of different way, which means that there is quite a bit of subjectivity a creative financial manager can inject in a company’s earnings. On the other hand, Net Income – income remaining after expenses – and Free Cash Flow – the cash left after operating expenses and capital expenditures – are generally more straightforward measurements with less subjectivity. I like to use all three measurements together. A pattern of growth in all three measurements is the ideal and best-case scenario, while divergences in one or more of these measurements relative to the others can signal problems that need to be examined in more detail.
One of the stocks that has become like an old, familiar friend for me for most of the past two years is Bristol-Myers Squibb Company (BMY). This is a stock that I’ve followed throughout 2020 and used a few times to nice overall effect, but that hasn’t drawn a ton of attention from market analysts and talking heads as most of the focus for the past sixteen months in the Health Care sector has revolved around COVID-19 and the companies in the sector on the front line of treatment and vaccine development.
Recent progress in total vaccinations and declining infection and hospitalization trends have finally prompted governments and the CDC to start lifting pandemic-driven restrictions and safety guideline; but even so, COVID has pushed health care facilities and medical professionals to their limits. Part of that, in my opinion is a reflection of the reality that, besides the pandemic, there is still a need for other types of health care as well. I think that is where BMY has an important role to play not only in society but in a smart investor’s watchlist right now. A big part of the stock’s performance over the last year, I think can be attributed to the pharmaceutical industry’s resilience this year as one of the market’s few bright spots during the initial part of the health crisis. In November of 2019, the company completed the acquisition of Celgene, with the first sets of combined annual financial statements coming this year. One of the elements that I think is drawing some bearish sentiment is the fact that Net Income for the combined business turned sharply negative over the last twelve months.
My read on that negative pattern is that it reflects challenges imposed not only by the integration of two large businesses but also by practical difficulties forced on the entire business world by the pandemic. There is no denying that 2020 had an operational impact on the company, but even so BMY still boasts one of the strongest, long-term development pipelines in the Pharmaceutical industry that became even less concentrated and more diversified with the completion of the Celgene acquisition, and dovetailing with what I think will inevitably be an increased level scrutiny and attention – appropriately so, and in the long run, to our collective benefit – on proper health and care on an individual level. While I think the current, negative Net Income pattern is ultimately a temporary concern, it is also true that it is one of the reasons the long-term, “fair value” target my analysis generates dropped following the last earnings report. Even so, the company’s other strengths, including robust, stable Free Cash Flow growth and a balance sheet with healthy liquidity to absorb its current negative Net Income. Let’s run the numbers.
Fundamental and Value Profile
Bristol-Myers Squibb Company is engaged in the discovery, development, licensing, manufacturing, marketing, distribution and sale of biopharmaceutical products. The Company’s pharmaceutical products include chemically synthesized drugs, or small molecules, and products produced from biological processes called biologics. Small molecule drugs are administered orally in the form of a pill or tablet. Biologics are administered to patients through injections or by infusion. The Company’s products include Empliciti, Opdivo, Sprycel, Yervoy, Eliquis, Orencia, Baraclude, Hepatitis C Franchise, Reyataz Franchise and Sustiva Franchise. It offers products for a range of therapeutic classes, which include virology, including human immunodeficiency virus (HIV) infection; oncology; immunoscience, and cardiovascular. Its products are sold to wholesalers, retail pharmacies, hospitals, government entities and the medical profession across the world. BMY has a current market cap of $145.8 billion.
Earnings and Sales Growth: Over the last twelve months, earnings were flat, but positive at 1.16%, while sales increased about 2.71%. In the last quarter, earnings were 19.18% higher while sales were flat at 0.05%. As previously mentioned BMY’s Net Income versus Revenue pattern is a red flag that bears watching; over the last twelve months this number was -14.5%, but strengthened to 18.25% in the last quarter. I attribute the biggest portion of the twelve=month, negative pattern to the transitory period required to integrate two huge operations into a single company. Add to the mix the complication of the pandemic, and I think that while the negative number is important, they are a temporary risk element. Improvement in these numbers in the quarterly number is a positive indication of stabilization.
Free Cash Flow: BMY’s Free Cash Flow is healthy, at $13.2 billion. That marks a pattern of steady improvement through the past year, from $11.7 billion two quarters prior and $9.7 billion at the beginning of 2020. The current number translates to a Free Cash Flow Yield of 9.14%. The strength in this number is a useful counterpoint to the negative Net Income pattern I just described and implies that the company’s ability to service its debt, maintain its dividend and keep business growing remains intact.
Debt to Equity: BMY has a debt/equity ratio of 1.18. This number is primarily attributed to the debt assumed during the completion of the Celgene deal. As of the last quarter, cash and liquid assets were $12.9 billion versus $44.5 billion in long-term debt. Pre-merger, BMY had just $5.3 billion in debt versus more than $8 billion in cash; however management as well as most analysts predicted the deal would be immediately accretive. So far that appears to be the case, which means the high debt level continues to be more than serviceable.
Dividend: BMY pays an annual dividend of $1.96 per share, which at its current price translates to a dividend yield of about 3.02%. Management increased the dividend from $1.80 per share, per annum in mid-2020. The increase is a strong signal of management’s confidence in its business strategy and overall financial strength.
Price/Book Ratio: there are a lot of ways to measure how much a stock should be worth; but I like to work with a combination of Price/Book and Price/Cash Flow analysis. Together, these measurements provide a long-term, fair value target around $94 per share, which suggests that BMY is very undervalued, with 44% upside from its current price.
Technical Profile
Here’s a look at the stock’s latest technical chart.
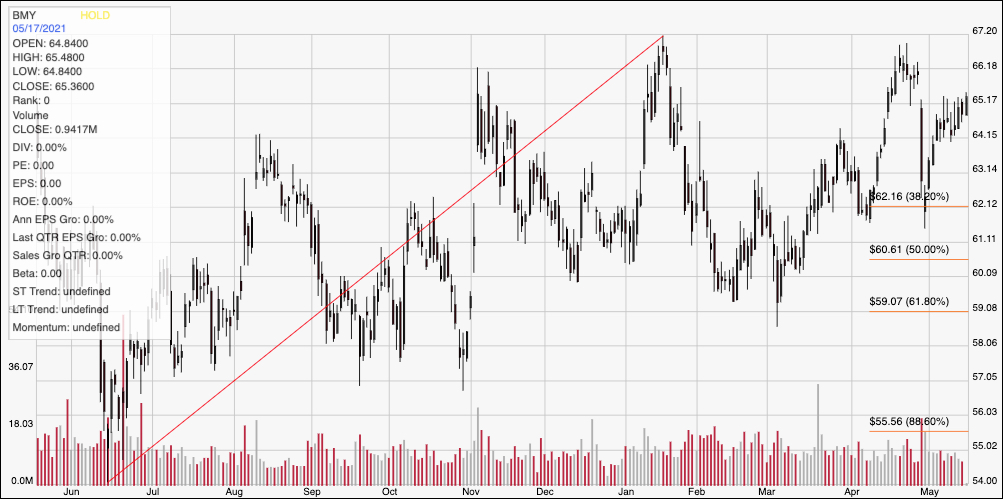
Current Price Action/Trends and Pivots: The chart above displays the last year of price activity for BMY. The red diagonal line traces the stock’s upward trend from June 2020 at around $54 to its high in January at around $67; it also provides the baseline for the Fibonacci retracement lines shown on the right side of the chart. Immediate resistance is around $67 at the January high, with current support sitting at around $64. A drop below $64 should find next support at the 38.2% retracement line around $62, while a push above $67 should have about $3 up immediate upside to about $70 per share.
Near-term Keys: The red flag in BMY’s fundamental profile is the negative Net Income pattern, and it remains a significant risk element; but I also believe that is a lingering remnant from the net, temporary effect of integrating Celgene into its organization. Their strong pattern of healthy Free Cash Flow, on the other hand offers a counterpoint that I think underscores their overall fundamental strength, even amid some current difficulties. The stock is only a few dollars below its 52-week high, but given the underlying fundamental strength, I still think the stock offers a fantastic value proposition far above that point. If you prefer to focus on short-term trading strategies, a push above $67 could offer a signal to consider buying the stock or working with call options, using $70 as a near-term profit target. A drop below $64, on the other hand could offer a good signal to think about shorting the stock or working with put options with an eye on $62 as a useful price target on a bearish trade.