As COVID-19 continues to fade as a primary concern in the U.S., analysts are naturally starting to talk about the pace of recovering economic activity. That includes just about every sector and industry that has been impacted by the pandemic-driven restrictions on social gathering, mask-wearing mandates and more, including the Consumer Discretionary sector, which includes retailers of every type.
One pocket of the economy that really took a big hit is big-box department stores. While other specialty retailers found ways to adjust, absorb the negative impact that initial shutdowns imposed and emerge hopefully better equipped for the future, department stores like Kohl’s Corporation (KSS) were already struggling to adjust to shifting consumer preferences towards online shopping and reliance on private labels and brands before the pandemic began. KSS borrowed heavily to bolster its cash and liquid assets early during the pandemic, which enabled the company to absorb much of the blow they took from an extended shutdown period.
The real question, I think is whether relaxed social gathering requirements, along with reopening economic activity for places like big-box retailers will translate to an increase in shopping activities? I think it’s interesting that a lot of analysts aren’t asking if consumer activity will rebound, but rather how long it will take for economic activity in many of the industries most dramatically impacted to return to pre-pandemic, 2019 levels. Specific to KSS, If the company can see meaningful, improving trends in store traffic and in other aspects of its own long-term transformation strategy, which puts a big emphasis on a partnership with Amazon to handle local returns and on its own digital commerce platform, the company may be in a good position for the future. After sitting at lows not seen in this century between $20 and $23 in 2020, the stock started to rally in a big way in November, peaking in May at around $65 and currently sitting just a little below that level. Have the company’s improving fundamentals kept pace with the increase in the stock price? Let’s try to find out.
Fundamental and Value Profile
Kohl’s Corporation (Kohl’s) is an operator of department stores. The Company operates approximately 1,154 Kohl’s department stores, a Website (www.Kohls.com), approximately 12 FILA outlets, and approximately three Off-Aisle clearance centers. The Company’s stores and Website sell moderately-priced private label and national brand apparel, footwear, accessories, beauty and home products. The Company’s Website includes merchandise that is available in its stores, as well as merchandise that is available only online. The Company’s merchandise mix includes both national brands and private brands that are available only at Kohl’s. The Company’s private brands include Apt. 9, Croft & Barrow, Jumping Beans, SO and Sonoma Goods for Life. The Company’s exclusive brands include Food Network, Jennifer Lopez, Marc Anthony, Rock & Republic and Simply Vera Vera Wang. KSS’s current market cap is $8.8 billion.
Earnings and Sales Growth: Over the last twelve months, earnings increased by nearly 133%, whiles sales increased nearly 60%. In the last quarter, earnings declined -53%, while sales also declined, by almost -37%. The company’s margin profile has historically been narrow, which does represent a risk element of which to be cautious. In the last twelve months, Net Income was 2.25% of Revenues, but weakened to 0.36% in the last quarter. This is a metric that leaves no margin for error; if this measurement turns negative for a sustained period of time, the company’s broader balance sheet, which has held up pretty well so far will start to be impacted.
Free Cash Flow: KSS’s free cash flow is generally healthy, at $1.5 billion. That marks an increase from about $1.2 billion in the last quarter, and $866 million a year ago. This is also a positive counterpoint to the Net Income picture I just painted. That also translates to a Free Cash Flow Yield of 17.41%, which admittedly is impressive given their narrowing Net Income.
Debt to Equity: KSS has a debt/equity ratio of .66. Cash and liquid assets increased by almost triple their level at the end of 2019, to a little more than $2.2 billion in the last quarter, while debt increased from $400 million in the middle of 2018 to nearly $3.4 billion in the most recent quarter. I think that their ability to pay down down debt (the company borrowed heavily at the onset of the pandemic, pushing long-term debt to more than $6 billion) while increasing liquidity is a big reason management announced the resumption of dividend distributions in the first quarter of 2021.
Dividend: KSS reinstated its dividend in the first quarter of 2021 at a rate of $1.00 per share, which translate to an annualized dividend yield of 1.79% at the stock’s current price.
Price/Book Ratio: there are a lot of ways to measure how much a stock should be worth; but I like to work with a combination of Price/Book and Price/Cash Flow analysis. Together, these measurements provide a long-term, fair value target around $45 per share. That suggests that the stock’s strong push upward this year has outpaced its fundamental strength, making the stock overvalued by -19%. It also puts the stock’s useful bargain price at around $36 per share.
Technical Profile
Here’s a look at the stock’s latest technical chart.
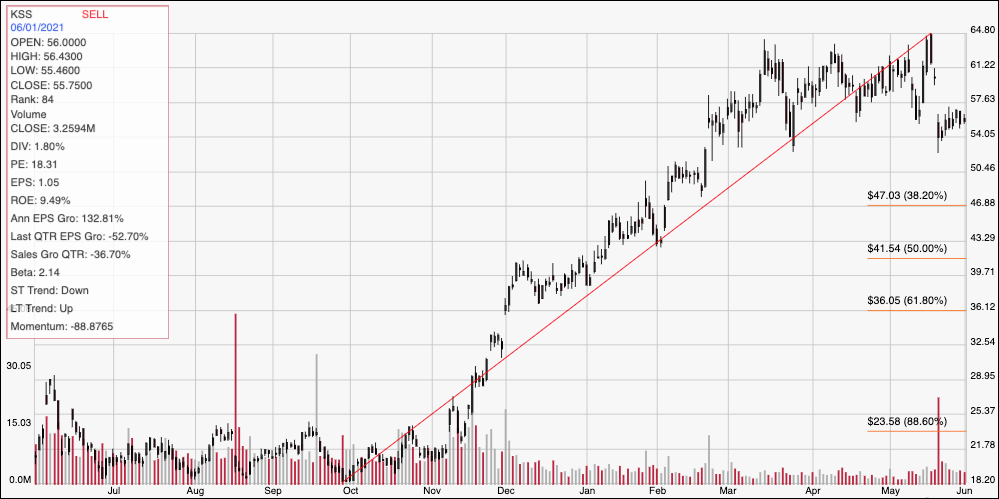
Current Price Action/Trends and Pivots: The chart above shows the last year of price movement for KSS. The red diagonal line traces the stock’s upward trend from an October low at about $18 to its peak around $65 last month. It also provides the baseline for the Fibonacci retracement lines shown on the right side of the chart. The stock has retraced off of its high, and appears to have found current support at around $54. Immediate resistance is around $57.50; a push above that point should give the stock room to rally to about $61 per share, and could possibly retest the stock’s 52-week high if bullish momentum strengthens. A drop below $54, on the other hand, could see the stock drop to about $50 before finding next support, with additional downside to about $47 where the 38.2% retracement line rests if bearish momentum accelerates.
Near-term Keys: KSS’s upward surge this year means that the stock is clearly overvalued, making it impractical to think about as a long-term investment at its current price. That means that the best probabilities lie in short-term trading strategies. If the stock can push above $57.50, you could use the move as an interesting signal to consider buying the stock or working with call options, using $61 to $65 as practical profit targets. A drop below $54 should be taken as a sign to consider shorting the stock or buying put options, using a range between $50 and $47 per share as a good bearish profit target.