Over the last year and a half, the Tech sector has led the market, where a number of stocks not only recovered their pre-pandemic highs but even surged to entirely new highs as investors piled into just about anything with even a tangential relationship to the global business shift to remote, cloud-based operations. The momentum had multiple layers of interest associated with it, from the shift to remote, telecommuting functions that helped keep much of corporate America working through the pandemic, to concerns about chip supply that restricted the ability of Semiconductor companies to provide memory storage.
In the semiconductor space, I like to pay attention not just to the producers – Intel, Advanced Micro Devices, Samsung Electronics, and so on – but also the companies that provide solutions and services to aid their production. That means equipment manufacturers, like Applied Materials Inc. (AMAT) are always of interest. This is a company whose balance sheet held up extremely well during the pandemic, even with concerns about chip supply.
AMAT’s stock performance really picked up steam from November 2020 to the early part of April, as the stock nearly tripled in price from around $54 to a multiyear high at around $146. Broad market momentum tapered off through April and into mid-May, which helped push the stock back off of that high point to around $112 per share, but in the last few weeks the stock has turned back and rallied again and is now just a few dollars away from that $146 high point. That big move is great for investors who had already been holding shares, what does it mean now? Do the company’s fundamentals support the argument for a higher price, or has this massive rally flipped the reward: risk equation against taking a new position now?
Fundamental and Value Profile
Applied Materials, Inc. provides manufacturing equipment, services and software to the global semiconductor, display and related industries. The Company’s segments are Semiconductor Systems, which includes semiconductor capital equipment for etch, rapid thermal processing, deposition, chemical mechanical planarization, metrology and inspection, wafer packaging, and ion implantation; Applied Global Services, which provides integrated solutions to optimize equipment and fab performance and productivity; Display and Adjacent Markets, which includes products for manufacturing liquid crystal displays, organic light-emitting diodes, upgrades and roll-to-roll Web coating systems and other display technologies for televisions, personal computers, smart phones and other consumer-oriented devices, and Corporate and Other segment, which includes revenues from products, as well as costs of products sold for fabricating solar photovoltaic cells and modules, and certain operating expenses. AMAT has a current market cap of $127.1 billion.
Earnings and Sales Growth: Over the last twelve months, earnings increased by a little over 83%, while sales improved by about 41%. That strong pattern was also seen in the last quarter; earnings increased nearly 17.27% while sales increased 8.14%. That earnings patterns has continued to reflect, at least in part, generally improving conditions in the memory market, where oversupply had previously been a big concern. Recent reports suggest increasing consumer demand for PC’s as well as increasing corporate order for enterprise-level products such as networking and storage solutions, all of which feed memory and chip demand. The company’s margin profile is impressive; Net Income versus Revenue was 22.35% over the last twelve months, and strengthened to 23.83% in the last quarter.
Free Cash Flow: AMAT’s Free Cash Flow is strong, at almost $4.2 billion. While this number declined from about $7 billion at the beginning of 2018, it is also up from around $3.7 billion in the last quarter and $2.5 billion at the end of 2018. The current number translates to a modest Free Cash Flow Yield of 3.34%.
Debt to Equity: AMAT has a debt/equity ratio of .45, which is conservative, and implies debt management shouldn’t be a problem. The company has nearly $6.7 billion in cash and liquid assets, which means they they have plenty of liquidity, against $5.4 billion in total long-term debt.
Dividend: AMAT pays an annual dividend of $.96 per share – an improvement from $.80 in 2019 and $.88 before the company’s most recent earnings announcement – and which, at its current price translates to a dividend yield of about 0.69%.
Price/Book Ratio: there are a lot of ways to measure how much a stock should be worth; but I like to work with a combination of Price/Book and Price/Cash Flow analysis. Together, these measurements provide a long-term, fair value target around $44 per share. That means that AMAT is significantly overvalued, with about -67% downside from its current price. It also puts a bargain price for the stock at around $35.50.
Technical Profile
Here’s a look at the stock’s latest technical chart.
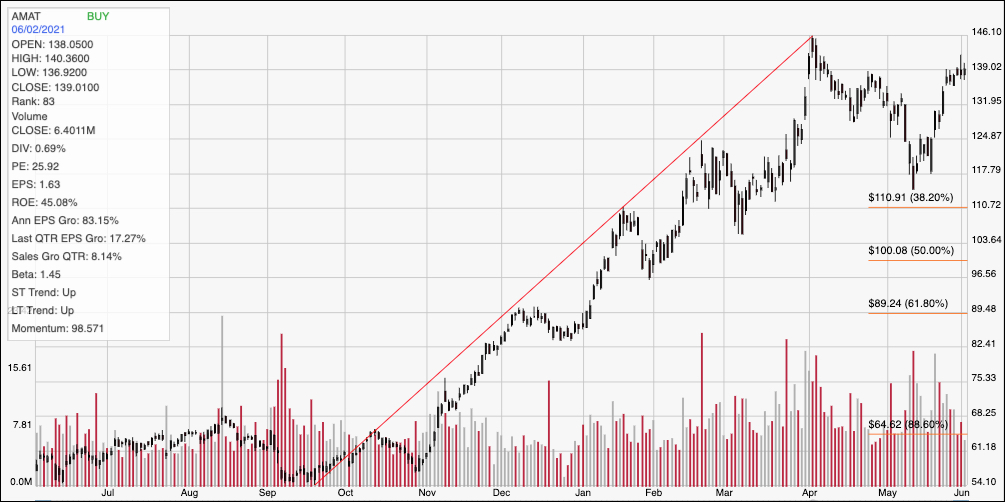
Current Price Action/Trends and Pivots: The chart above covers the last year of price activity. The red line traces the stock’s upward trend from a September 2020 low around $54 to its April high at around $146. It also provides the baseline for the Fibonacci retracement lines shown on the right side of the chart. The stock dropped off of that high point to find support at around $112 in early May and start pushing back towards its peak. The stock is only a few dollars away from that April high, which puts immediate resistance at $146 and current support at around $138. A drop below $138 could have short-term downside to about $128 per share, while the stock is about $8 away from resistance at the 52-week high and appears to be building momentum.
Near-term Keys: If you prefer working with short-term, momentum-based trades, I think the current difference between likely support and resistance suggests that the stock offers about $8 of upside (at the most) versus about $10 of downside right now, which means that even on a short-term basis, this stock has more risk than reward. That means that the probabilities of success in bullish trades right now are very, very low. A continued push off of support, and above $140 could shift that dynamic enough to offer a useful signal to buy the stock or work with call options, so long as you intend to take quick profits at around $146. On the other hand, a drop below $138 would stand as a strong signal to short the stock or to buy put options, with a target price at around $128. What about the value proposition? AMAT’s fundamentals are solid; but given the way the stock’s price performance has clearly outpaced its fundamental improvements, there is really no way to think about AMAT as any kind of useful long-term value-based buy right now.