Short-term trading to take advantage of swings between very near-term highs and lows, or long-term investing with an eye on how much a stock should be worth? it’s a question that anybody that wants to use the stock market to put their money to work for them has to figure out for themselves. Short-term trading strategies such as swing or momentum-based trading methods usually lend themselves nicely to the kinds of growth-oriented stocks that tend to dominate commentary on popular market media, while longer-term questions tend to get pushed to the background. Sometimes – not often, but sometimes – the two methods converge and complement each other.
The S&P 500 pushed to a new record close to start this week, while volatility seems to be dropping. That generally calls into question how sustainable short-term, broadly bullish market momentum may be; and given the generally unsettled nature of the market over the last month amid questions about the pace of inflation and whether current monetary policy is finally being too accommodative as economic activity increases, some of that uncertainty is warranted. That uncertainty, in fact is what is creating the convergence between generally divergent investing attitudes that I opened today’s article describing.
Kellogg Company (K) is a good example of what I mean. They do a lot more than just cereal, of course, but the truth is that the cereal aisle is where you recognize them the most quickly. After following the broad market to a bearish low in March 2020 around $54, the stock rebounded to a peak in late July at nearly $73. From that point, the stock dropped back into a clear downward trend that bottomed in late February around $55, but then saw the stock rebound to a new near-term high in early May at around $68. From that point, the stock has dropped back to find a new support level that appears to be giving the stock a launch point to extend its short-term upward trend. The convergence between that short-term set up and a long-term mindset is that even with its rise in price since February, K’s balance sheet remains healthy, with improving profit and operating margins and a healthy dividend providing good evidence of sustained fundamental strength. Together, that means that means that both short-term traders and longer-term, value-focused investors have a great reason to keep paying attention to this stock. Let’s dive in to the numbers.
Fundamental and Value Profile
Kellogg Company is a manufacturer and marketer of ready-to-eat cereal and convenience foods. The Company’s principal products are ready-to-eat cereals and convenience foods, such as cookies, crackers, savory snacks, toaster pastries, cereal bars, fruit-flavored snacks, frozen waffles and veggie foods. Its segments include U.S. Morning Foods, which includes cereal, toaster pastries, health and wellness bars, and beverages; U.S. Snacks, which includes cookies, crackers, cereal bars, savory snacks and fruit-flavored snacks; U.S. Specialty, which represents food away from home channels, including food service, convenience, vending, Girl Scouts and food manufacturing; North America Other, which includes the U.S. Frozen, Kashi and Canada operating segments; Europe, which consists of European countries; Latin America, which consists of Central and South America and includes Mexico, and Asia Pacific, which consists of Sub-Saharan Africa, Australia and other Asian and Pacific markets. K’s current market cap is $22.3 billion.
Earnings and Sales Growth: Over the last twelve months, earnings increased a little over 12%, while revenues were 5% higher. In the last quarter, earnings were 29% higher, while sales increased about 3.5%. The company operates with a healthy margin profile; over the last twelve months, Net Income during was 9.12% of Revenues, and increased in the last quarter to 10.27%.
Free Cash Flow: K’s free cash flow is $1.26 billion and translates to a Free Cash Flow Yield of 5.7%. It should also be noted that Free Cash Flow has improved, from about $947 at the beginning of 2020, but also dropped from the prior quarter when it was about $1.48 billion. Debt to Equity: K has a debt/equity ratio of 1.82. This is a high number, and makes them one of the most heavily leveraged stocks in the Food Products industry. Their balance sheet indicates that in the last quarter, cash and liquid assets were a little over $391 million, versus $6.65 billion in long-term debt. That marks a decline from the last six months, when cash was $1.5 billion against $7 billion in long-term debt.
Price/Book Ratio: there are a lot of ways to measure how much a stock should be worth; but I like to work with a combination of Price/Book and Price/Cash Flow analysis. Together, these measurements provide a long-term, fair value target around $89 per share, which means that K remains very undervalued, with about 37% upside from its current price.
Technical Profile
Here’s a look at the stock’s latest technical chart.
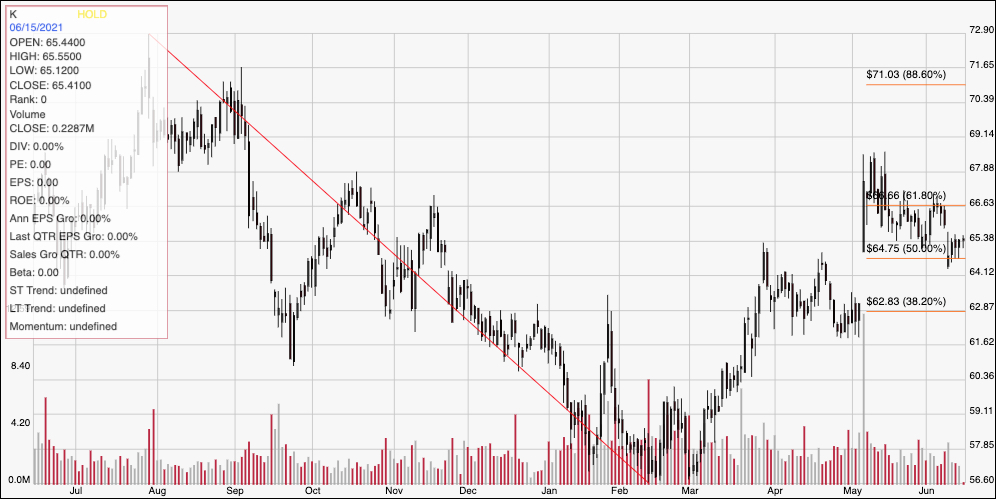
Current Price Action/Trends and Pivots: This chart traces the stock’s movement over the last year. The diagonal red line traces the stock’s downward trend from its late July 2020 peak at around $73 to its March low at around $57. It also provides the baseline for the Fibonacci retracement lines shown on the right side of the chart. From that low, the stock’s momentum drove its price to a peak in May at around $68 and a little above the 61.8% retracement line. That peak also marks immediate resistance. The stock has dropped back from that point, but found support at around $65 – inline with the 50% retracement line – last week and appears to be pivoting back up from that point. A drop below support at $64 has additional downside to around $63 to $62, based on previous pivot activity and the 38.2% retracement line, while a push above $68 should see short-term upside to $71 at least, with the stock’s 52-week high at around $73 within reach if bullish momentum strengthens.
Near-term Keys: Even with K’s current intermediate-term upward trend, the value proposition on this stock is compelling, with a nice technical pullback providing a good “buy the dip” kind of set up. If you’re willing to accept the possibility of some near-term volatility, K is a stock that offers an excellent long-term opportunity. If you prefer to focus on short-term trading strategies, you could use a push above resistance at $68 as a signal to consider buying the stock or working with call options, using next resistance at around $71 as a good exit points. A drop below $65, on the other hand could provide a useful signal to consider shorting the stock or buying put options, using $63 to $62 as a useful profit target on a bearish trade.